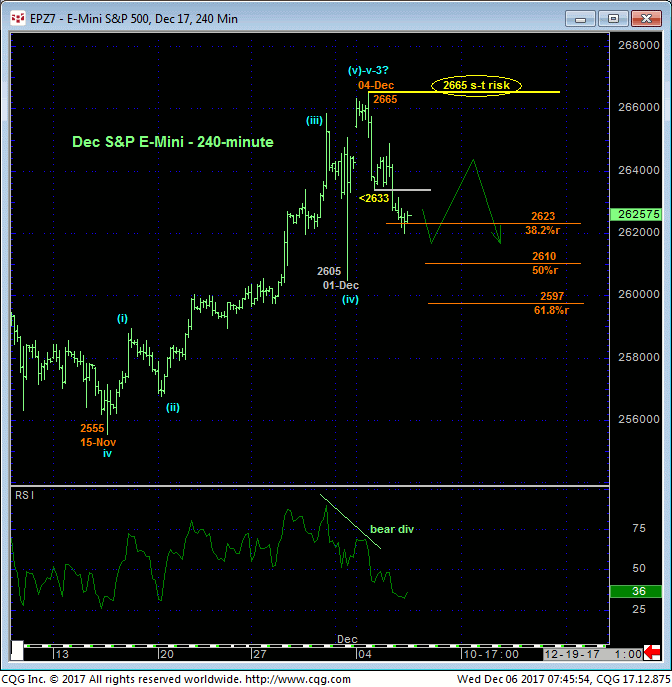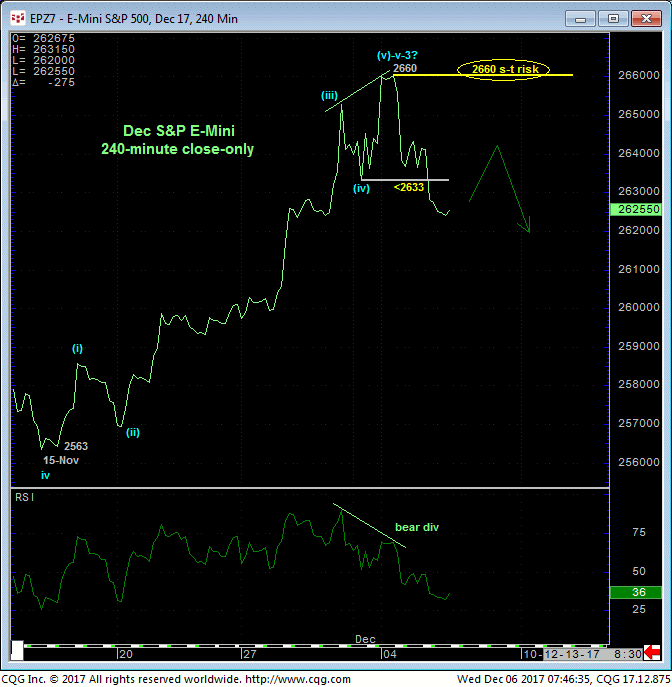
Although the 240-min chart below shows that the market has yet to fail below last Fri’s 2605 intra-day corrective low, we believe its failure yesterday below Mon’s 2633 initial counter-trend low as well as a 240-min close below Fri’s 2633 corrective low close is sufficient to conclude a bearish divergence in momentum and complete 5-wave Elliott sequence from 15-Nov’s 2555 low to Fri’s 2665 high as labeled above. Per such Fri’s 2665 high serves as a tight but objective risk parameter from which traders can objectively base non-bullish decisions like long-covers and cautious bearish punts.


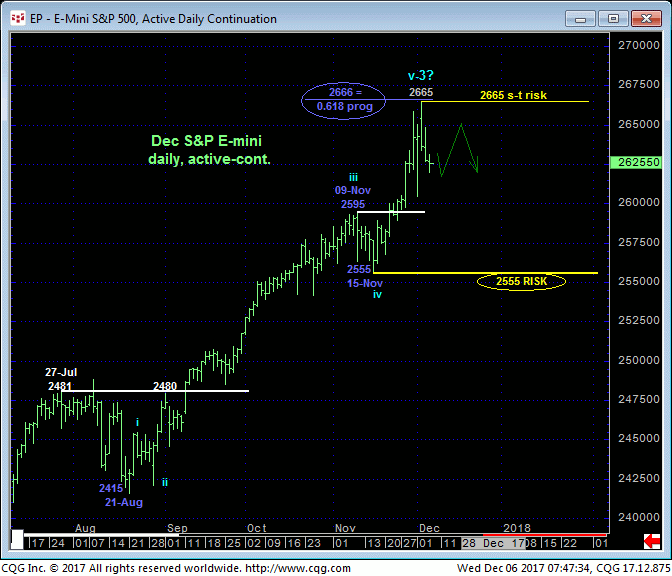
Contributing to an interim peak/correction threat is the Fibonacci fact that the portion of the secular uptrend from 15-Nov’s 2555 low spanned a length exactly 61.8% of the preceding rally from 21-Aug’s 2415 low to 09-Nov’s 2595 high shown in the daily chart below. Given the prospect here too that the entire rally from 21-Aug’s 2415 low is a complete 5-wave affair as labeled, we cannot ignore the prospect of a more protracted correction in the weeks and perhaps months ahead as long as the market sustains levels below Fri’s 2665 high and new short-term risk parameter.
To truly confirm the break of the past four months’ uptrend however, commensurately larger-degree proof of weakness below 15-Nov’s 2555 larger-degree corrective low and key risk parameter remains required. Given that this may be an impractical amount of risk for even longer-term traders, they can now exchange whipsaw risk for longer-term nominal risk by paring bullish exposure and re-establishing it if/when the market recoups 2665.

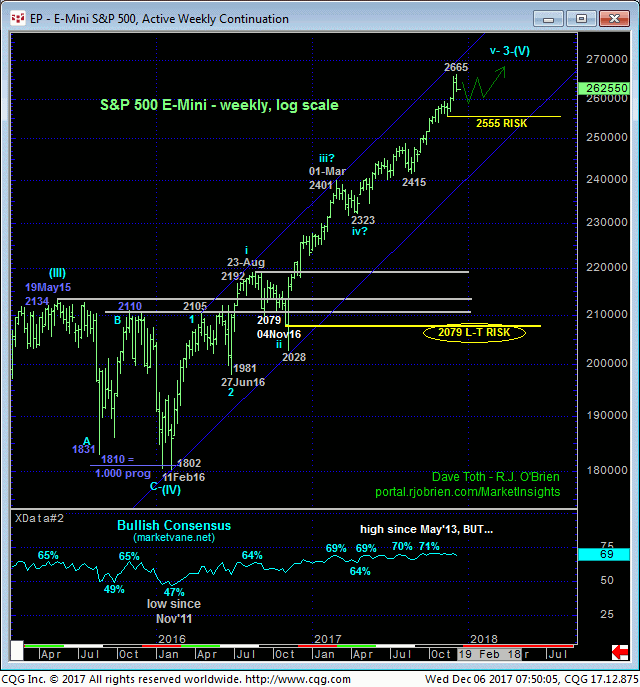
From a very long-term perspective the weekly log chart below shows the magnitude of the secular bull market where few of this year’s corrections barely even register. On this basis a failure below 15-Nov’s 2555 low is MINIMALLY required to break the uptrend from Aug’s 2415 low, let alone threaten the secular bull. In lieu of such sub-2555 weakness longer-term players remain advised to maintain our policy for this entire year and first approach setback attempts as corrective3 buying opportunities.
These issues considered, shorter-term traders are advised to pare or neutralize bullish exposure to reduce or circumvent the risk of an interim corrective setback that will remain a threat until and unless the market recoups Fri’s 2665 high and new short-term risk parameter. Obviously, a recovery above 2665 will mitigate any peak/correction count and reinstate the secular bull to indeterminable heights. Longer-term players are OK to pare bullish exposure to more conservative levels and exchange whipsaw risk for larger nominal risk with a recovery above 2665 negating this call and warranting a return to full bullish exposure.


