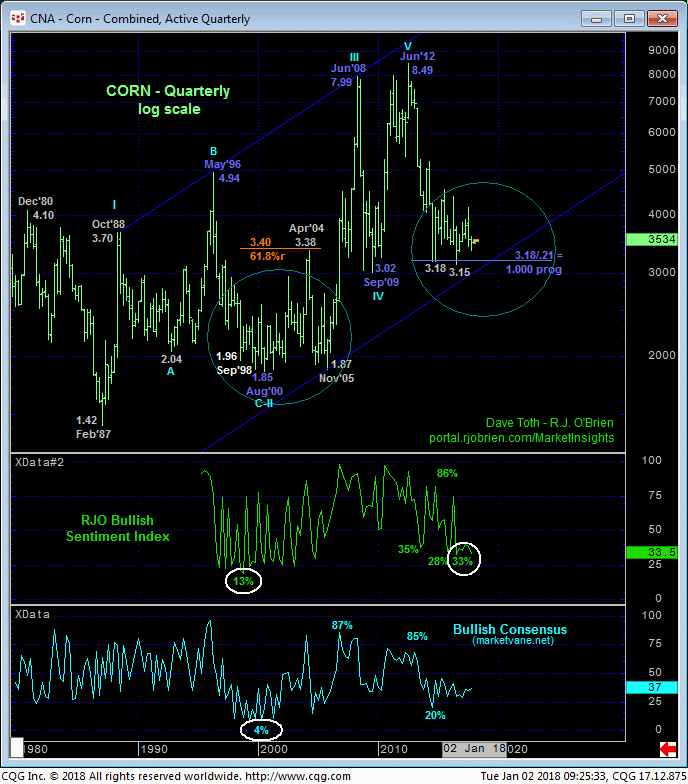
Mid-to-late-Dec’s rebound from 3.46 to last week’s 3.54-1/4 high is pretty non-descript, stalling at about the middle of Dec’s 3.61 – 3.46-range. Approaching the glass as half-full however if you’re biased towards a broader bullish count, there are a number of factors that are encouraging, like it’s trending, impulsive nature. Nonetheless, as this market has yet to recover above a prior corrective high of a sufficient scale OR an initial counter-trend high, the magnitude of the broader downtrend from 11-Jul’s 4.26 high still requires us to approach recovery attempts as corrections ahead of another round of new lows.
As a result of Thur/Fri’s relapse we’re considering 3.55 as our short-term risk parameter we believe the market needs to now stay below to conclude the recent 3.46 – 3.54 pop is a correction within a more immediate bearish count. An admittedly smaller-degree source of strength above 3.55 won’t allow us to conclude a larger0degree base/reversal count, but it would be a seed-planter that, with additional factors described below, could grow into a more extensive move higher.
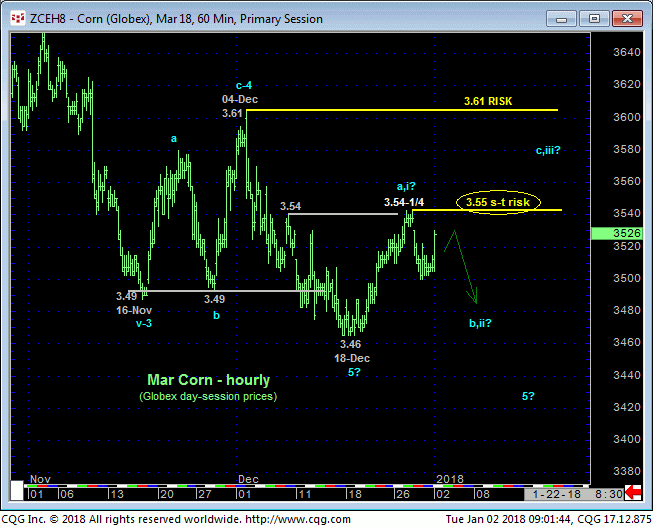
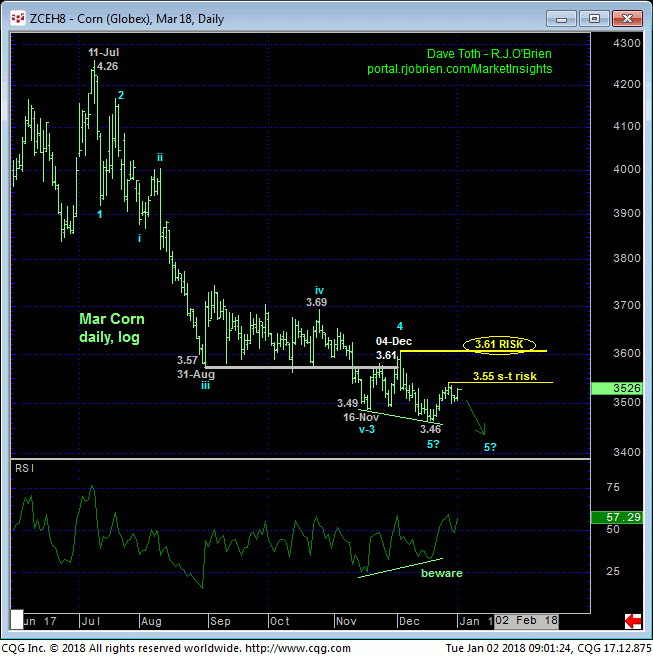
From a commensurately larger-degree perspective, 04-Dec’s 3.61 corrective high and area of former support-turned-resistance remains intact as our key risk parameter this market needs to recoup to confirm a bullish divergence in momentum of a SCALE SUFFICIENT to conclude 18-Dec’s 3.46 low as the END of a 5-wave Elliott sequence down from 11-Jul’s 4.26 high. On a daily close-only basis below 01-Dec’s 3.59 corrective high close serves as this pivotal flexion point.
IF IF IF something broader to the bear side is still unfolding, we believe it is critical for this market to sustain losses below this 3.59-to-3.61-area. Its failure to do so will, at a minimum, stem a 6-month downtrend. At most it would reinforce what we believe is a major, multi-year BASE/reversal count that could plant the seed for a 2018 rally to at least the lower-$4.00-handle and possibly much more, presenting an outstanding risk/reward buying opportunity.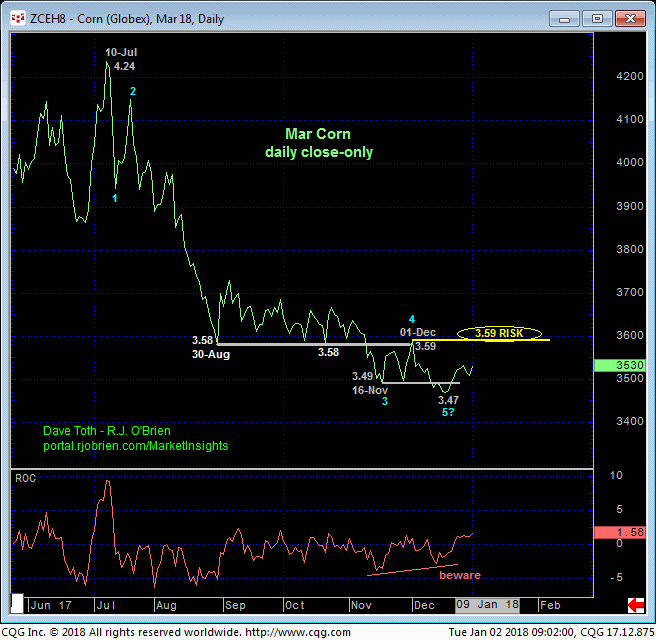
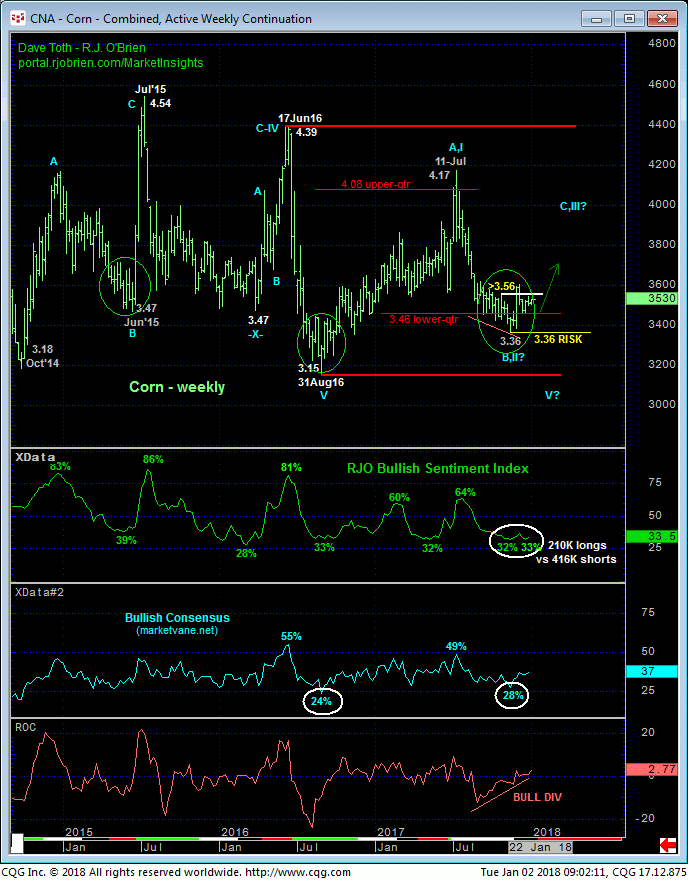
A number of factors contribute mightily to this long-term base/reversal-threat count, including:
- the market’s current position at the lower-quarter of the 3-YEAR range
- a confirmed bullish divergence in momentum on a weekly active-continuation chart basis above amidst
- historically bearish sentiment levels that have warned of and accompanied every significant recovery over these past three years.
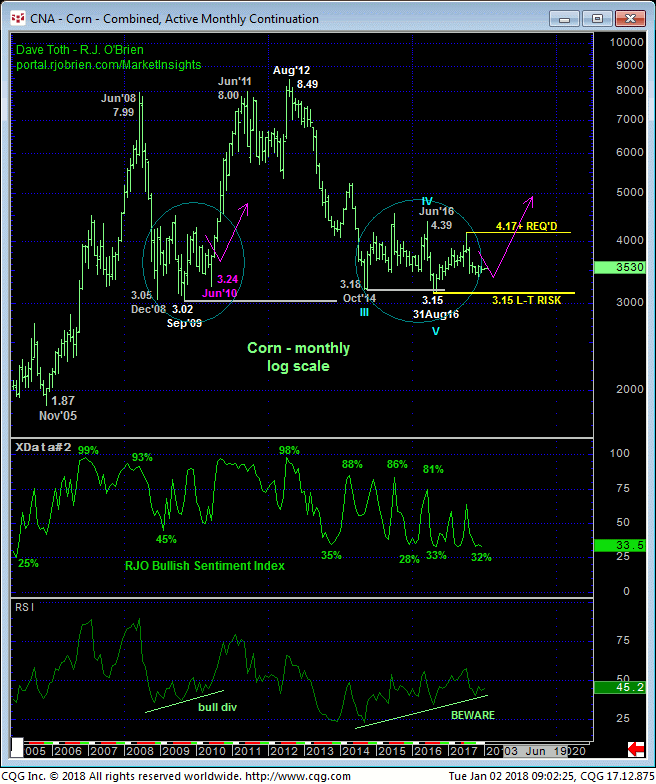
Additionally, on a monthly log scale basis above, it’s not hard to see the similarity of the past three years’ basing behavior to that that followed Dec’08’s 3.05 low. Also, and as we’ve discussed many times over the past three years, the Fibonacci fact that the major bear market from Jun’12’s 8.49 high has spanned a length identical (i.e. 1.000 progression) to BOTH the 2008-09 bear and 1996-to-2000 bear cannot be ignored as further evidence of a MAJOR base/reversal-threat factor as long as Aug’16’s 3.15 low remains intact.
Will we be able to conclude a move to $5, $6 or $7 if/when the market recovers above 3.61? Of course not. But neither will such a move be able to be objectively ruled out. These issues considered, a cautious bearish remains OK “down here” at what we believe to be very slippery slope levels. Short-term strength above 3.55 will be the first evidence threatening a bearish call and warrants a move to the sidelines by shorter-term traders. Subsequent strength above 3.61 will mitigate any bearish count and warrant an immediate move to a neutral/sideline policy by longer-term players with subsequent relapse attempts first approached as corrective buying opportunity. In effect we believe the 6-cent range between 3.55 and 3.61 to be a critical one around which directional biases and exposure are urged to be toggled.
