MAR CHICAGO WHEAT
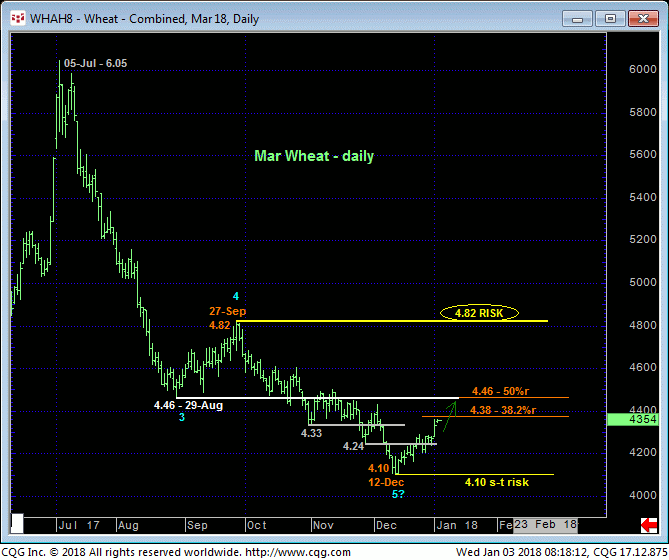
One would be hard pressed to find a bigger dog across the entire commodity market spectrum than the wheat market. But every dog has its day. And while we are certainly not in the business of bottom-picking, yesterday’s sharper continuation of a 2-week rebound not only reaffirms an intermediate-term uptrend, the market is starting to reach admittedly shorter-term levels that allow us to conclude 12-Dec’s 4.10 low as the END to at least the portion of the major bear trend from 27-Sep’s 4.82 high. Per such we are considering that 4.10 low our new short-term parameter from which the risk of any non-bearish decisions like short-covers and cautious bullish punts and hedges can be objectively based and managed.
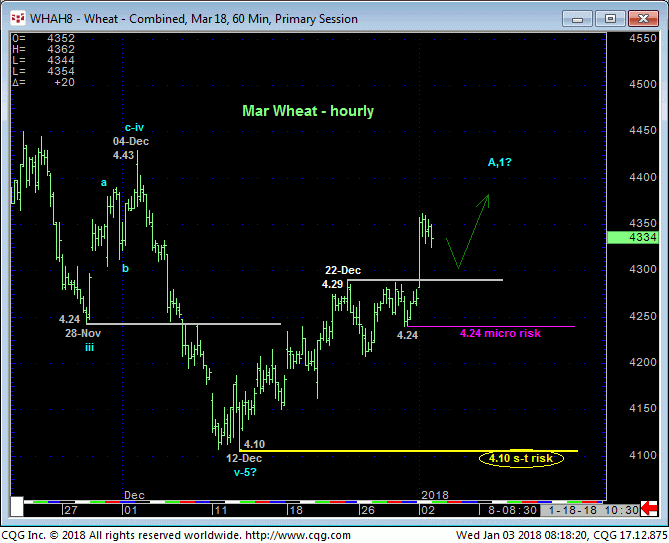
On an even tighter scale detailed in the hourly chart below, yesterday’s “breakout” above prior 4.29-area resistance leaves Fri’s 4.24 low in its wake as the latest smaller-degree corrective low and micro risk parameter from which scalpers can objectively base and manage the risk of cautious bullish punts.


From a longer-term perspective the bear trend in Mar wheat is big and broad enough that former 4.46-area support from late-Aug still serves as the tightest level of new resistance this market remains minimally required to recoup to even defer the bear, let alone threaten it. And 27-Sep’s 4.82 larger-degree corrective high remains intact as our key long-term risk parameter and gateway to a major reversal higher.
This said and with the market having now retraced exactly 38.2% of Sep-Dec’s 4.82 – 4.10 decline, it is safe and objective to conclude that 12-Dec’s 4.10 low COMPLETED at least the portion of the the bear trend from that 27-Sep high at 4.82. This leaves the market exposed to AT LEAST a larger-degree correction of a 2-1/2-month, 72-cent decline OR a more extensive correction or reversal of 2017’s entire bear trend from 05-Jul’s 6.05 high.
Of course the market has yet to come close to providing the evidence necessary to more objectively speculate on such a broader base/reversal count. Again, strength above at least the 4.46-area is required for this. But the market has at least identified some lows at 4.24 and certainly 4.10 that it can now be required to relapse below to threaten or negate a base/reversal count.

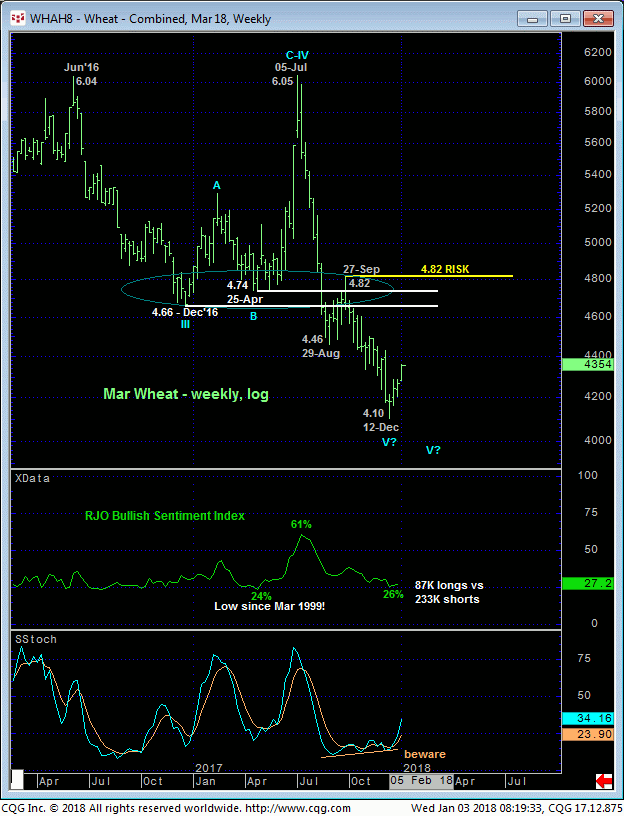
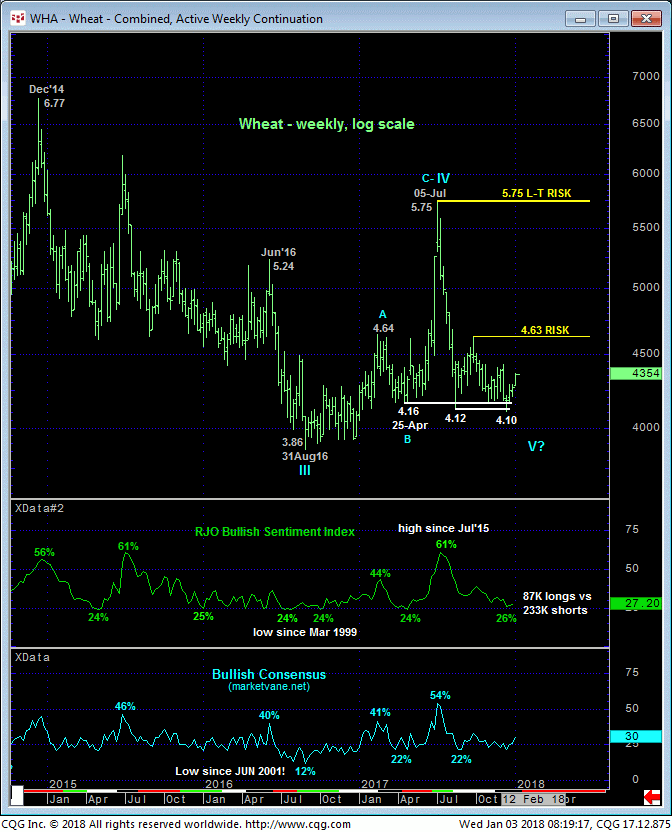
A potential might contributor to a base/reversal-threat environment is the historically bearish sentiment understandably accorded this market. Shown in both the weekly chart of the Mar contract above and weekly log active-continuation chart below, the Bullish Consensus (marketvane.net) and our proprietary RJO Bullish Sentiment Index of the hot managed Money positions reportable to the CFTC have been dawdling around historical lows typical of major base/reversal environments.
We have always reminded traders that sentiment is not an applicable technical tool in the absence of a bullish (in this case) divergence in momentum of a SCALE SUFFICIENT to break or threaten the major downtrend. And indeed, the past couple weeks’ bounce is far from sufficient relative to the magnitude of the secular bear trend. But this bearish sentiment element is lying in the weeds and will become a more pertinent factor if/when the market pokes above 4.46 and then certainly above 4.82.
Another potentially bullish factor on the active-continuation basis below is the market’s rejection thus far of the 4.16-to-4.12-area that has repelled it for the past EIGHT MONTHS, further highlighting 12-Dec’s 4.10 low as one of developing importance until and unless it is broken.
We would also remind traders of our three reversal requirements of:
- 1. a confirmed bullish divergence in momentum
- 2. proof of trendy, impulsive behavior on an initial counter-trend rally, and, perhaps most important,
- 3. proof of labored, 3-wave, corrective behavior on a subsequent relapse attempt.
Arguably, this market has satisfied NONE of these requirements, so it would certainly be very, very early in any sort of base/reversal-threat speculation. Nonetheless and for the reasons cited above, we believe 12-Dec’s 4.10 low serves as one of developing importance and a more reliable parameter from which the risk of any non-bearish decisions can be objectively based and managed.
These issues considered, shorter-term traders are advised to move to a neutral/sideline policy and first approach setback attempts to 4.29 OB as corrective but cautious buying opportunities. Protective sell-stops can be placed at 4.23 and/or 4.09. Longer-term players remain OK to maintain a bearish policy and exposure with strength above 4.46 required to pare exposure to more conservative levels and commensurately larger-degree strength above 4.82 to jettison the position altogether and swing over to a new bullish policy.


