FEB GOLD
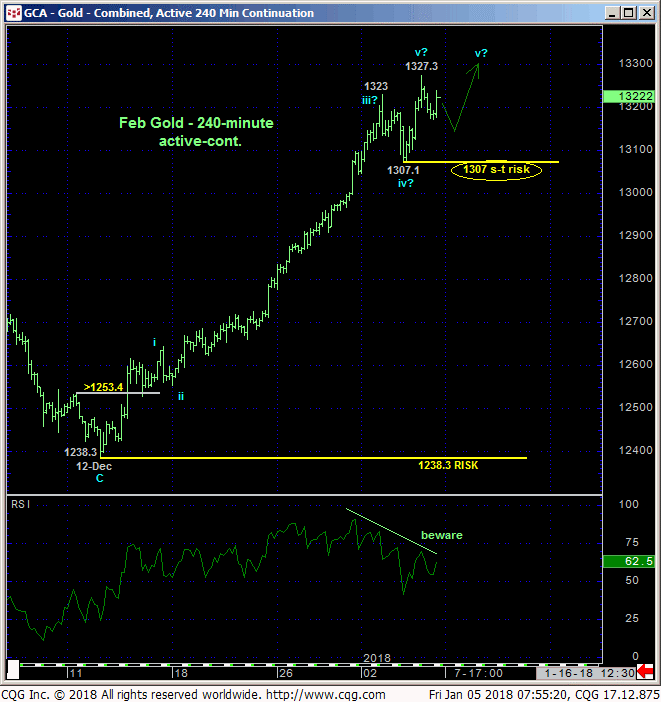
Yesterday’s continuation of the past three weeks’ impressive rally above Wed’s 1323 high leaves yesterday’s 1307.1 low in its wake as the latest corrective low this market now needs to sustain gains above to avoid confirming a bearish divergence in momentum that would break the uptrend. In this regard we are identifying 1307.0 as our new short-term risk parameter from which traders can objectively rebase and manage the risk of a still-advised bullish policy.
The developing POTENTIAL for a bearish divergence is clear in the RSI measure of momentum in the 240-min chart below. Along with the possibility that this week’s resumed rally could be the completing wave of a 5-wave Elliott sequence up from 12-Dec’s 1238.3 low, a failure below 1307 would certainly be a threat to the bull and a bullish policy. However, PROOF of weakness below 1307 is required to CONFIRM the divergence to the point of non-bullish action like long-covers and cautious bearish punts. Until and unless such sub-1307 weakness is proven, at least the intermediate-term uptrend remains intact and should not surprise by its continuance or acceleration.
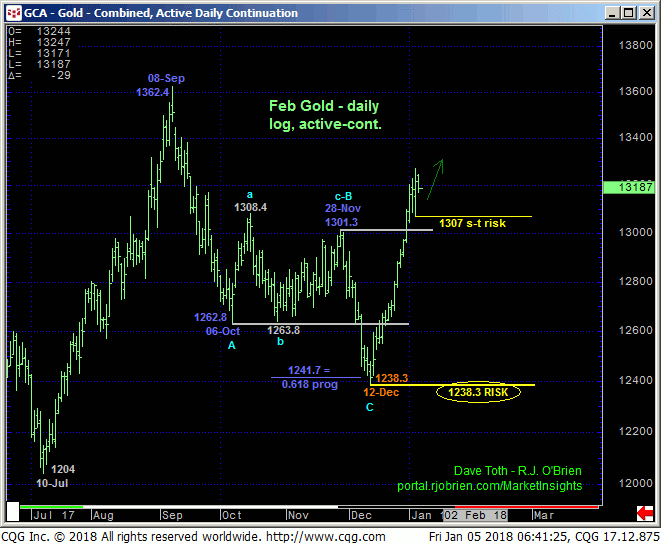
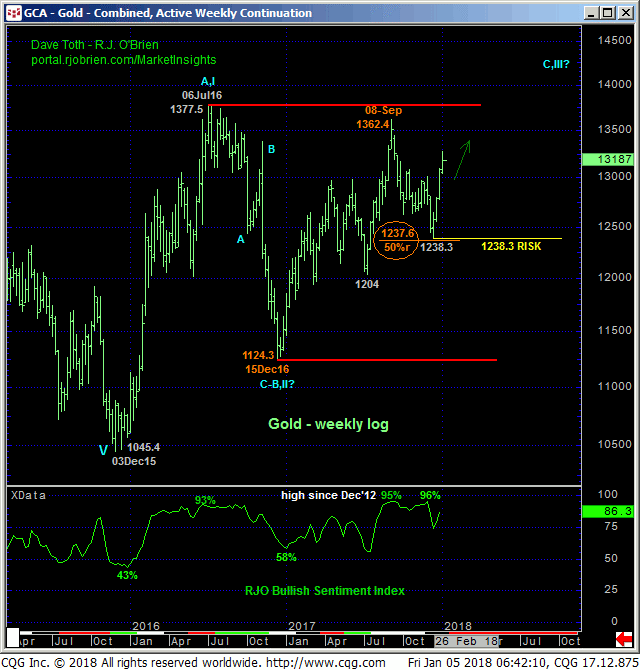
Within the context of what we still believe is a major, multi-year base/reversal count to eventual gains well above Jul’16’s 1377 high, the daily (above) and weekly (below) log scale charts show the bull still “contained” by the 1362-to-1377-area that defines the key upper boundary of the past year-and-a-half’s range. With this resistance still intact bulls need to approach the upper-quarter of this range as a slippery slope and move to a more conservative approach to risk assumption. Identifying yesterday’s 1307.1 low as a tight but objective parameter around which the risk of a bullish policy can be effectively rebased and manage does exactly this.
From a longer-term perspective and as a result of the extent and impulsiveness of the recent rally from 12-Dec’s 1238.3 low, that low serves as our key long-term risk parameter this market is minimally required to fail below to even defer, let alone threaten our long-term bullish count.
These issues considered, a bullish policy remains advised with a failure below 1307 required for shorter-term traders to move to the sidelines and even longer-term players to pare bullish exposure to more conservative levels. In lieu of such sub-1307 weakness further and possibly accelerated gains should not surprise.
MAR SILVER
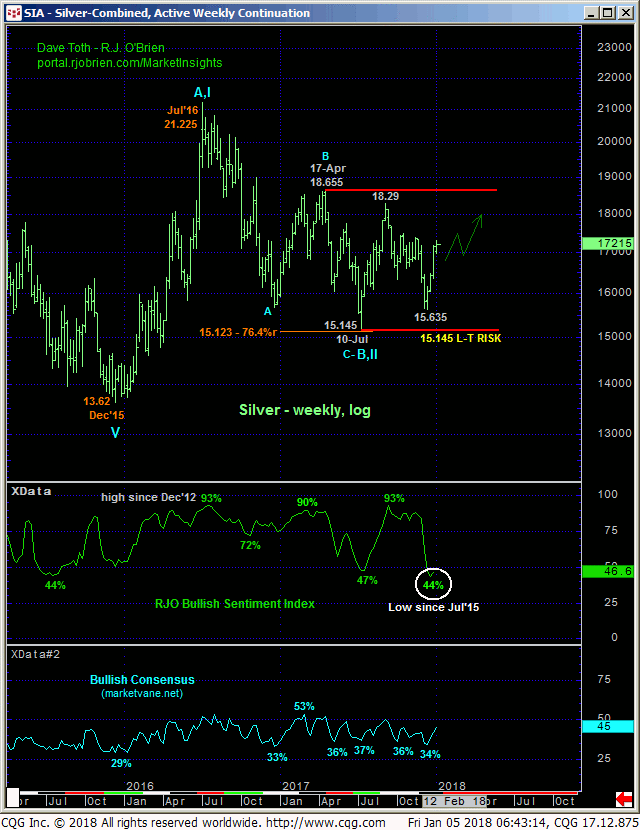
The technical construct of the silver market is virtually identical to that detailed above in gold with yesterday’s 17.025 low the latest smaller-degree corrective low and new short-term risk parameter the market is now required to fail below to arrest the clear and present uptrend and expose another intra-2017-range corrective relapse. In lieu of at least such sub-17.025 weakness at least the intermediate-term trend remains up and should not surprise by its continuance.
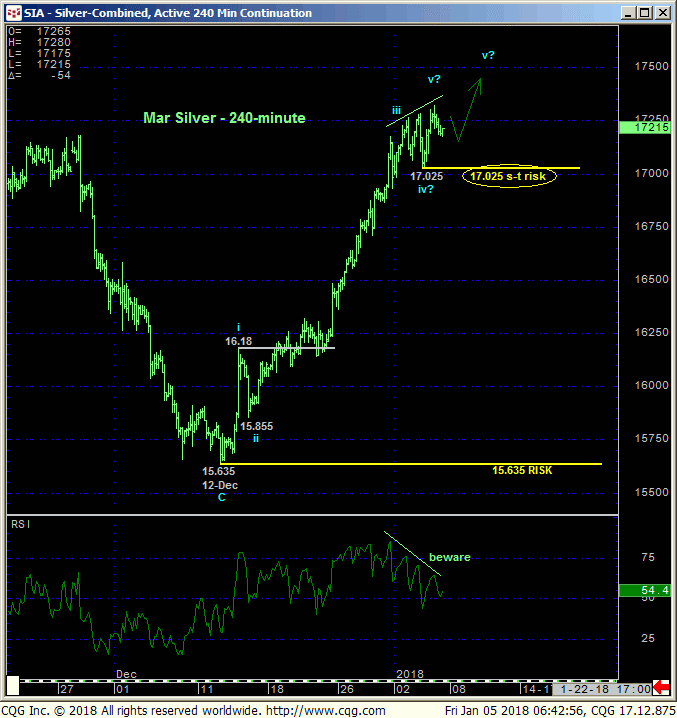
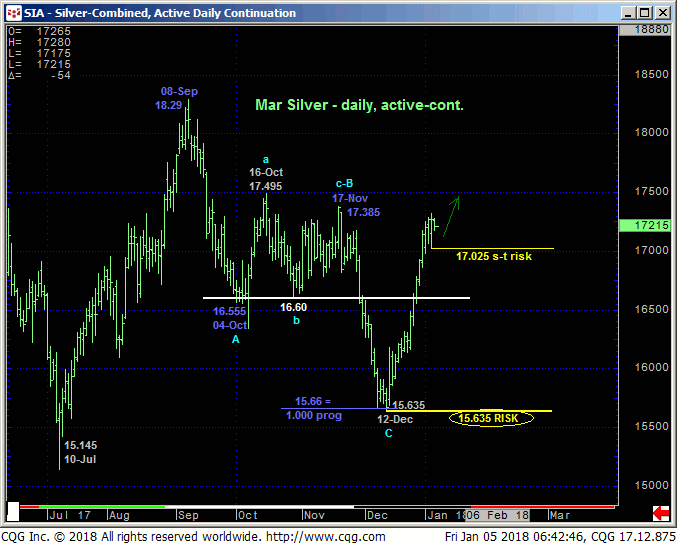
The daily chart above shows the market engaging the mid-17-handle area that capped this market as resistance for the two months of Oct and Nov and cannot be ignored as a resistance candidate. An admittedly short-term mo failure below 17.025 would certainly acknowledge this area as still a resistant hurdle. Given the extent and impulsiveness of the current rally from 12-Dec’s 15.635 low however as well as Sep-Dec’s clear 3-wave and thus corrective decline that reinforces our long-term bullish count, it would be premature to conclude a correction lower until and unless this market proves at least short-term weakness below 17.025. Current multi-year lows in our RJO Bullish Sentiment Index also warn of upside vulnerability that’s consistent with our preferred longer-term bullish count.
In sum, a bullish policy remains advised with a failure below 17.025 required for shorter-term traders to move to the sidelines and longer-term players to pare bullish exposure to more conservative levels in order to circumvent or reduce the risk of an interim corrective relapse of indeterminable scope.
