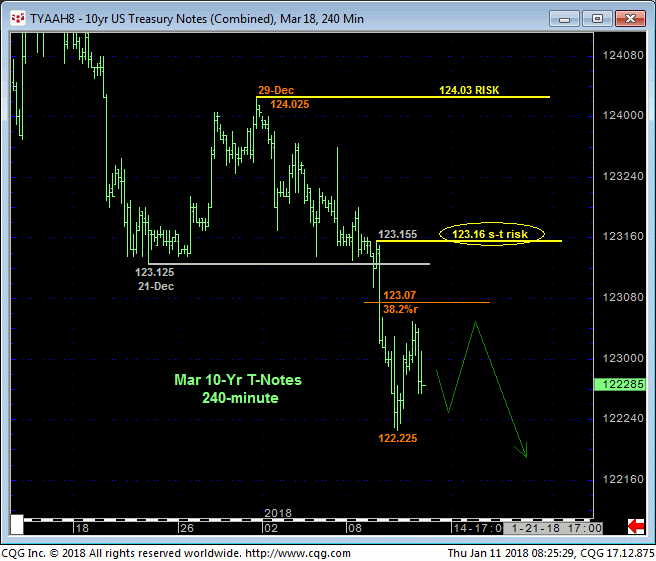
While this week’s continued losses obviously reinforce a bearish count, the extent and accelerated manner of the decline could be critical to the prospective break of the 122-handle area that has provided nothing less that monumental support for over FOUR YEARS. As a result of this latest spate of weakness, the 240-min chart above shows that Tue’s 123,155 high serves arguably as a smaller-degree corrective high and level that this market is now minimally required to recoup to jeopardize the impulsive integrity of a more immediate bearish count. Its location just above former 123.125-area support from 21-Dec and thus new resistance would seem to reinforce this 123.155 high as a tighter but objective risk parameter to a still-advised bearish policy.
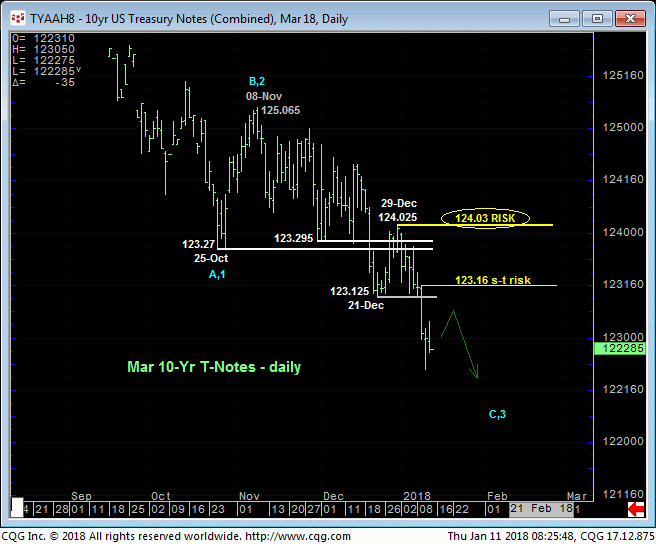
On a daily basis below the market can look back on nearly two months of 2-steps-down-step-up / falling-wedge-type price action that we’ve observed many times act as a sort of “coil” within a trend before that trend goes ballistic. Regardless of this observation however, the simple facts of the matter thus far are:
- the downtrend has accelerated
- former 123-12-area support serves as a new near-term resistance candidate
- 29-Dec’s 124.025 larger-degree corrective high serves as THE high and key risk parameter this market is now required to recoup to, in fact, break the major downtrend.
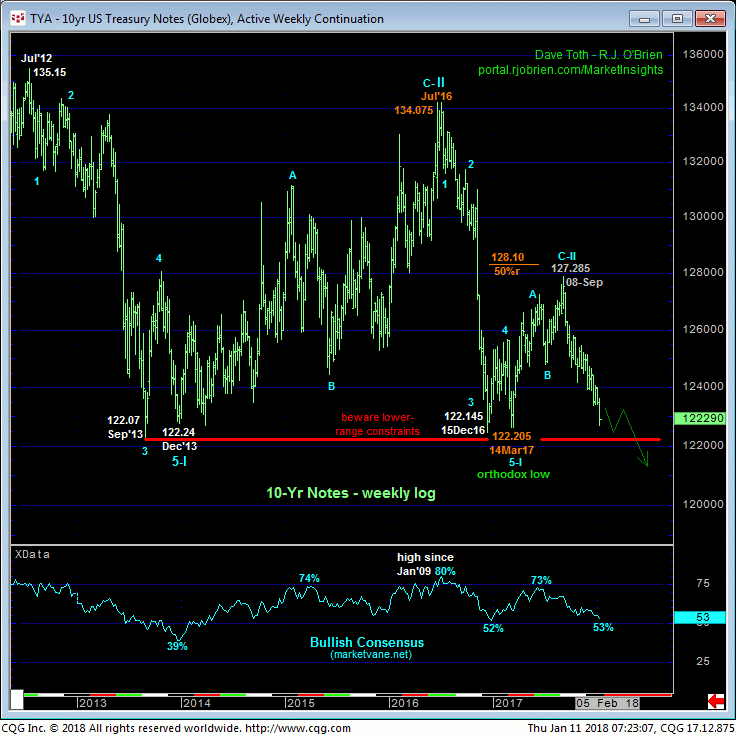
A bearish count reinforced by recent accelerated losses AND the smaller- and larger-degree corrective highs and risk parameters specified above may come in handy as the market engages the extreme lower recesses of the 122-to-134-range that has dominated prices for the past four years. If there is a time and place for this market to bottom once again and expose another intra-range recovery that could be extensive, it is here and now. And we will gauge such a base/recovery/reversal threat by the market’s inability to first sustain shorter-term losses below 123.16 and then, subsequently, below 29-Dec’s key 124.025 high.
Traders are reminded of our very, very long-term count that contends that 2012-13’s decline from 135.15 to 122.24 is just the first leg of a paradigm shift from 30 years of falling rates to a long-term environment of rising rates that could span a generation. The extent and impulsiveness of Jul’16 – Mar’17’s relapse, subsequent labored, corrective recovery to 08Sep17’s 127.285 high and the current relapse and severe retest of the multi-year lows do nothing but reinforce this massive, long-term bearish count reintroduced in 14Sep17’s Technical Webcast.
A clear break below the 122-handle, of course, remains required to reaffirm this bearish count, so the battle “down here” around this 122-handle will be crucial and extraordinarily interesting in the days and weeks ahead. For the time being however, a bearish policy remains advised with minimum strength above 123.16 required for shorter-term traders to step aside and subsequent and commensurately larger-degree strength above 124.03 for longer-term players to take similar defensive steps. What lies beneath 122.00 is 1) anyone’s guess and 2) potentially massive.
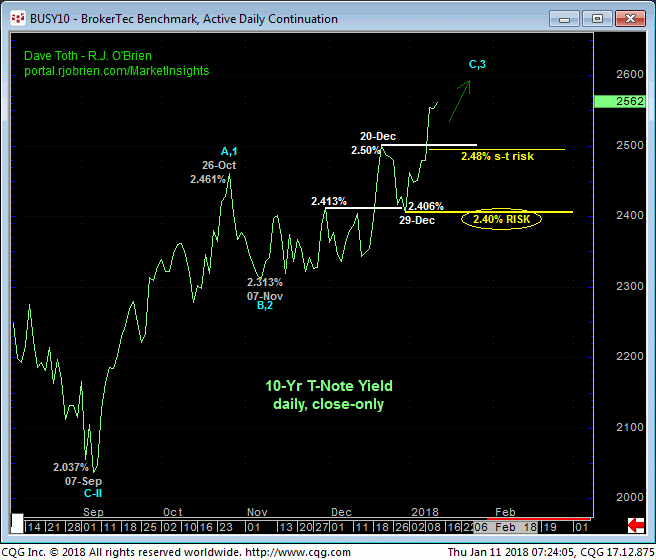
From a yield perspective the daily log close-only chart below shows the developing uptrend with 29-Dec’s 2.40% corrective low the key risk parameter this market needs to relapse below to negate a more immediate count calling for higher rates. an intra-day low from Tue at 2.48% serves as a short-term flexion point and risk parameter.
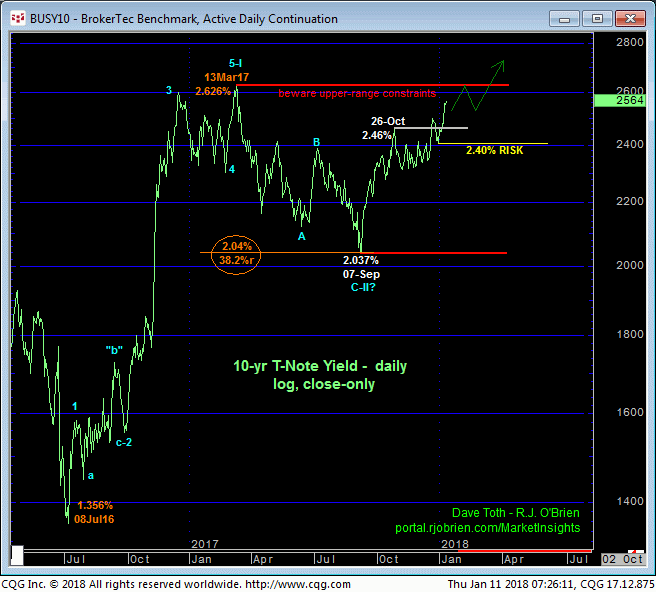
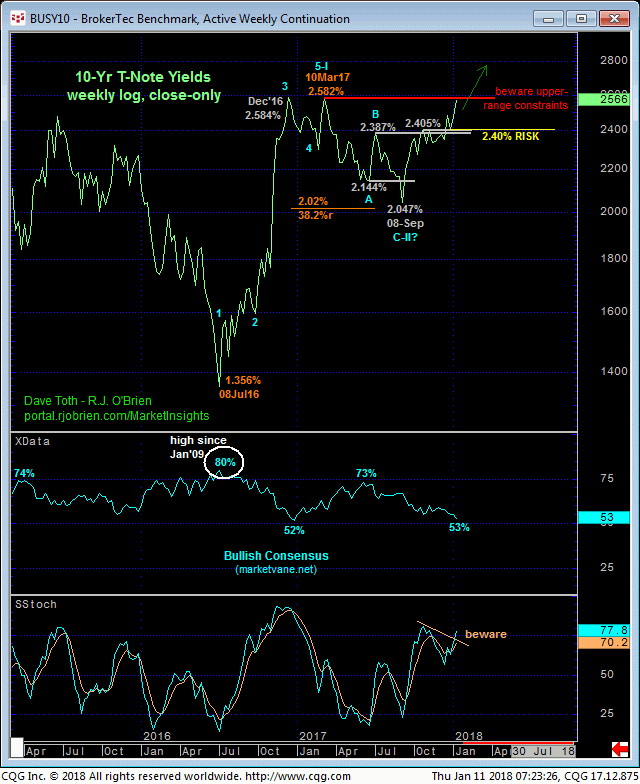
The daily log close-only chart above and weekly log close-only chart below show the extent of the market’s recovery from a 6-month, exact 38.2% retracement of the Jul’16 – Mar’17 rally that is unmistakable as a corrective event. The current question/challenge is whether the Sep low in rates ENDED the correction or just identified its lower boundary ahead of further consolidation that could span months or quarters ahead.
What’s also clearly indicated by these longer-term 10-yr maps is Mar’17’s 2.58%-to-2.62% high and resistance. A break above this area would reinstate what we believe is a new secular move higher in rates that could span quarters or even years. This would highlight recent corrective lows in rates like 2.48% and 2.40% as the key parameters from which the risk of policy calling for higher rates can be objectively rebased and managed.
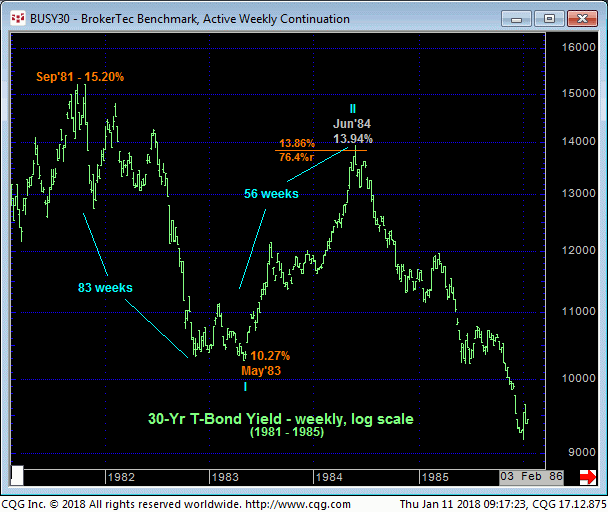
As a final consideration and comparison/contrast to the massive, multi-year base/reversal-threat environment we believe is currently in full swing, the weekly log close-only chart below is that of the multi-year PEAK/reversal process in 10-yr yields that unfolded around 35 years ago that included a steep, year-long corrective retest of the 1981 high. When, in Jun of 1985, the market broke below May’83’s 10.27% initial counter-trend low in rates, the market NEVER looked back. 10-yr rates spent the next 31 YEARS trending lower.
Makes ya wonder what lies above Mar’17’s 2.62% high.
