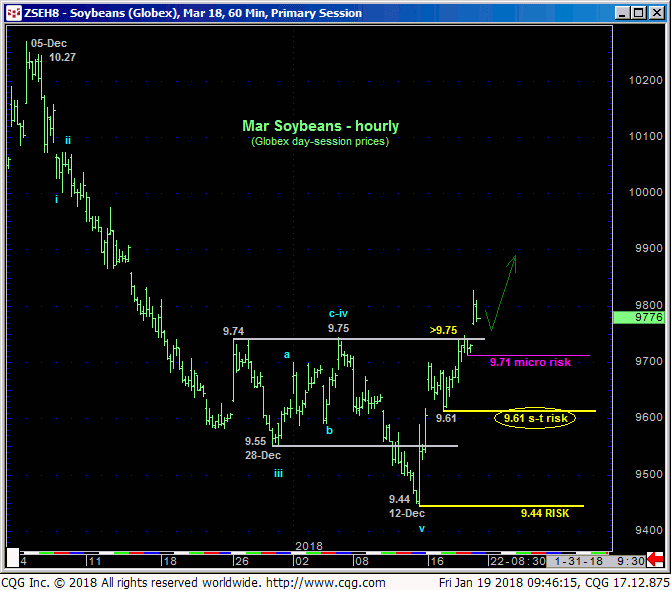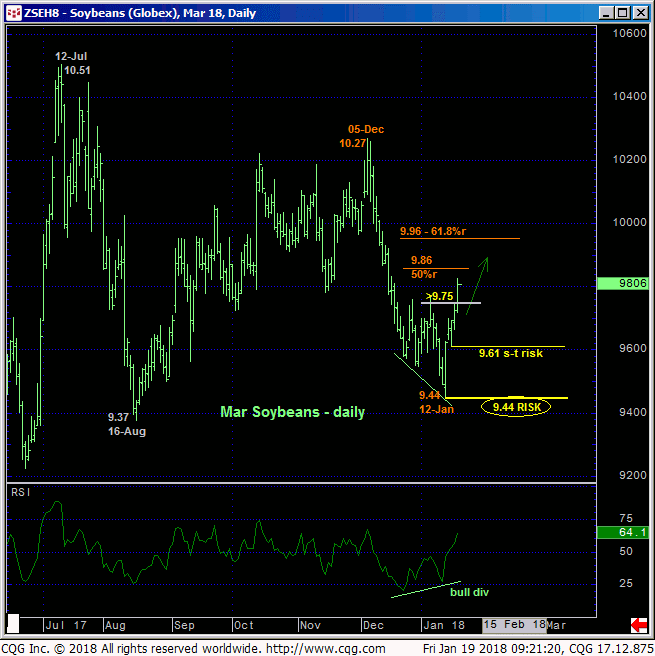

The market’s recovery today above the 9.75 level we identified as a tight but important risk parameter in 10-Jan’s Technical Blog confirms a bullish divergence in momentum that defines 12-Dec’s 9.44 low as the END of the decline from 05-Dec’s 10.27 high and start of a larger-degree correction or reversal higher.
We are not fans of initiating/chasing directional exposure on such an initial counter-trend rally as the risk of a (b- or 2nd-wave) corrective rebuttal as part of a broader base/reversal PROCESS is always there. When this market confirmed its bearish divergence on 11-Dec to stem the Aug-Dec rally however, the market came unglued right away and didn’t produce such a counter.
To address this dilemma, we have noted micro- and smaller-degree corrective lows at 9.71 and 9.61 in the hourly chart above that may be considered as micro- and short-term risk parameters to any bullish exposure established from the 9.80-area OB. Former 9.75-area resistance would now be expected to hold as new support if the market is immediately strong. And clearly, 12-Dec’s 9.44 low serves as the new key low and risk parameter from which a longer-term bullish count and policy can now be objectively based and managed.


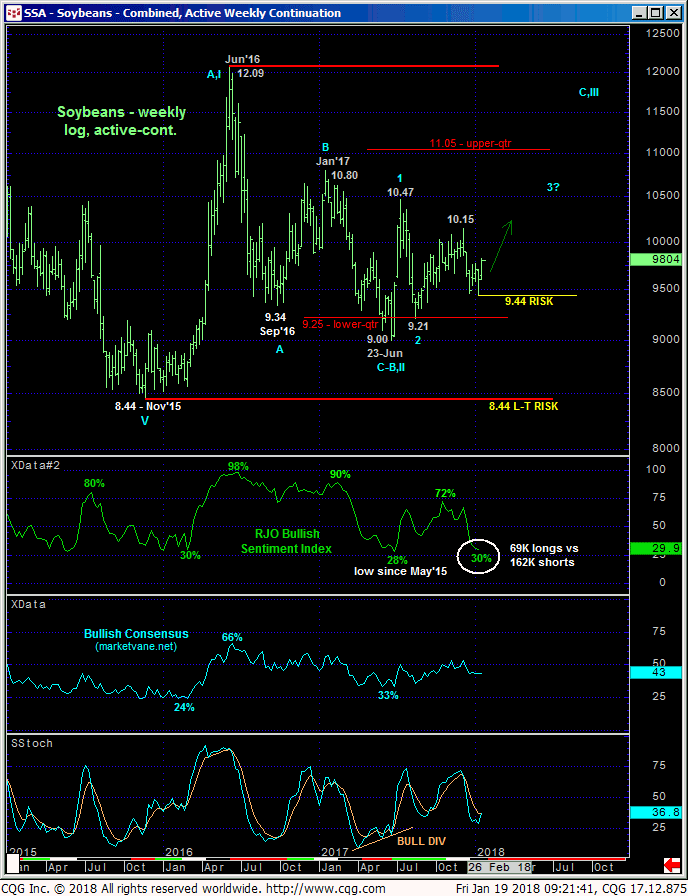
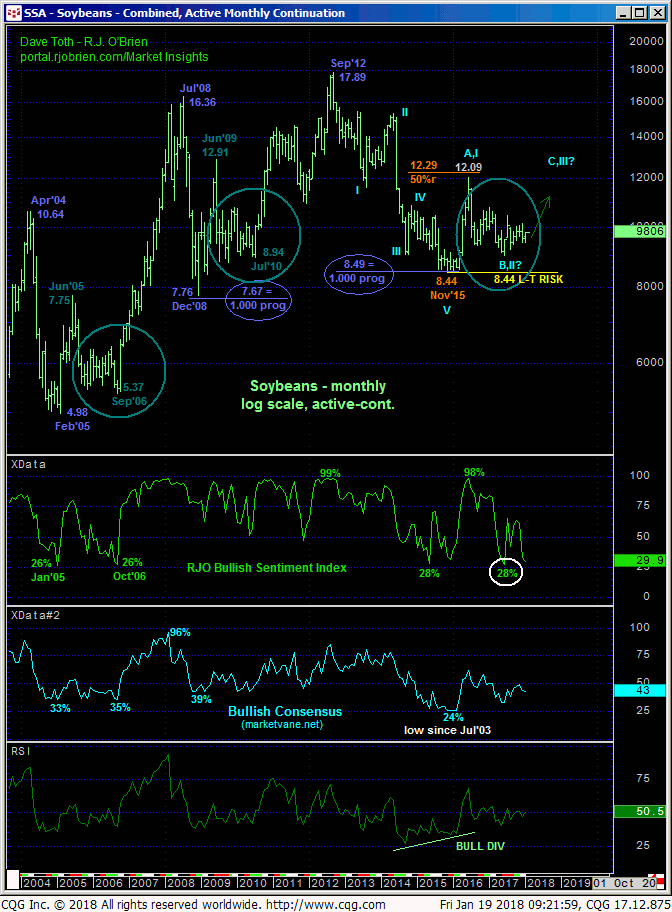
While the market’s position still deep within the middle-half bowels of the past year-and-a-half’s lateral range between 9.00 and 10.80 arguably inhibits any forecasts for a sustained move higher, traders are reminded of what we still contend is a MAJOR base/reversal environment that dates from Oct’14’s 9.04 low. The bear has had multiple chances to break the lower-quarter of the 3-YEAR range, let alone Nov’15’s 8.44 low, and has failed to do so repeatedly.
Now, with Dec-Jan’s intra-range relapse producing another historically low level in our RJO Bullish Sentiment Index that has been “activated” as a contributor to a broader base/reversal threat as a result of today’s bullish divergence in momentum, the market is vulnerable to at least another intra-range rebound. At most, this crop year could witness the kind of major reversals that followed virtually identical price and sentiment conditions that followed the Dec’08 low and Feb’05 low.
These issues considered, all previously recommended bearish policy and exposure has been nullified on today’s recovery above 9.75. Furthermore, traders are advised to establish cautious bullish positions at 9.77 OB with protective sell-stops below 9.71 or 9.44 commensurate with the trader’s personal risk profile. In lieu of weakness below at least 9.71, further and possibly accelerated gains should not surprise straight away. Former 9.75-area resistance would be expected to hold as new support per a more immediate bullish count. The market’s upside potential is indeterminable.


