MAR HEATING OIL
Following up Fri’s break below Wed’s 2.0493 initial counter-trend low, today’s break below 19-Jan’s 2.0363 low confirms the bearish divergence in momentum necessary to conclude 26-Jan’s 2.1362 high as one of developing importance and the end to the rally from at least 07-Dec’s 1.8597 low. The past couple days’ resumed weakness leaves Fri’s 2.1005 high in its wake as the latest smaller-degree corrective high the market needs to recoup to stem the slide, render the sell-off attempt from the 26-Jan high a 3-wave and thus corrective affair and re-expose the secular advance. In lieu of at least such 2.1005+ strength a more protracted correction or reversal may be at hand given broader Elliott Wave and sentiment reasons we’ll discuss below. In this regard Fri’s 2.1005 high becomes our new short-term risk parameter from which non-bullish decisions like long-covers and cautious bearish punts can now be objectively based and managed.
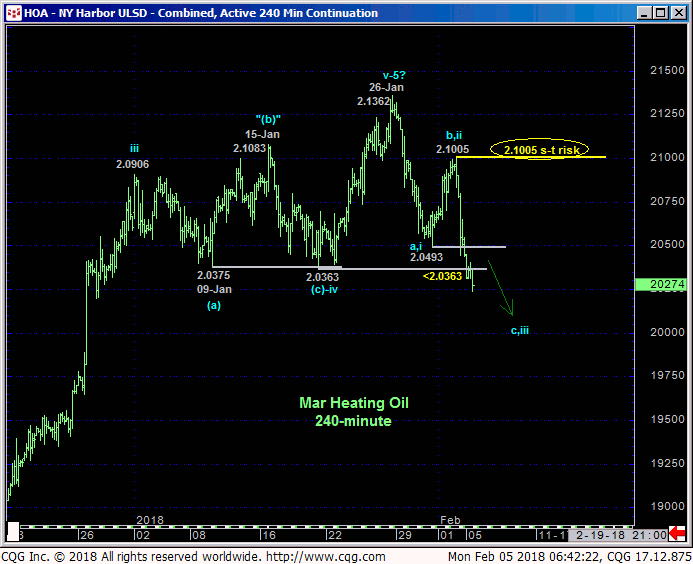
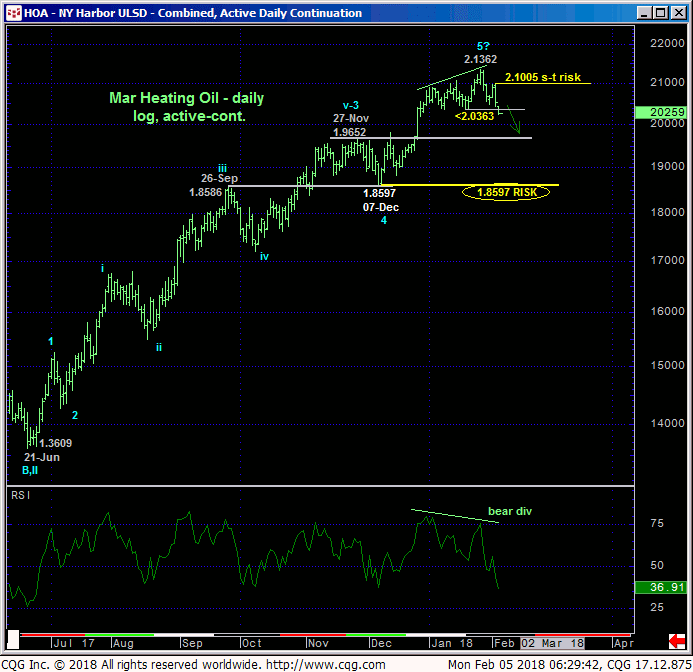
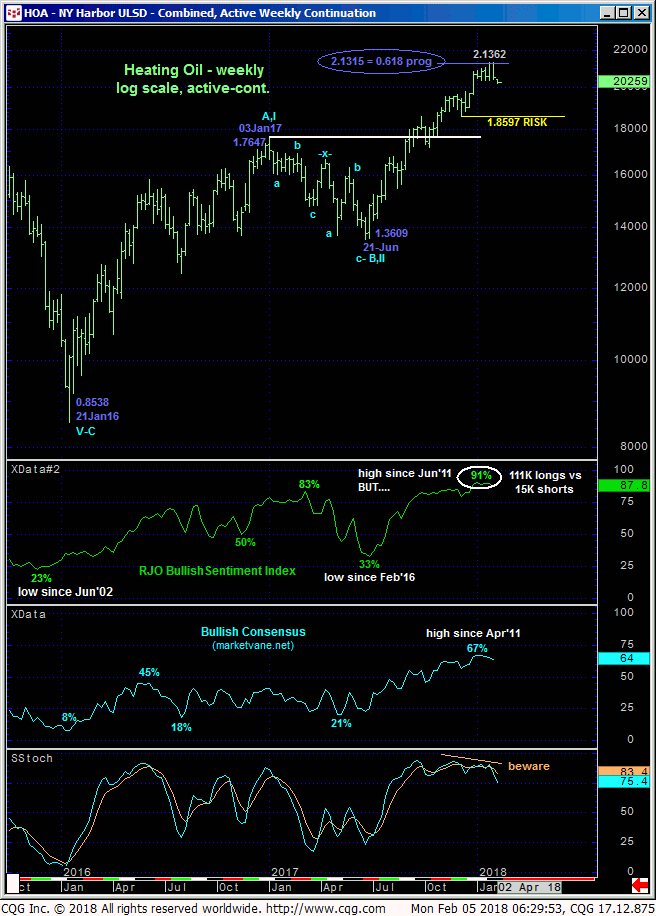
In addition to the bearish divergence in momentum, the following factors would seem to contribute to a count for at least an interim correction lower, if not a more protracted setback:
- the prospect that the entire rally from 21Jun17’s 1.3609 low is a complete 5-wave Elliott sequence as labeled above
- historically frothy levels in our JO Bullish Sentiment Index of the hot Managed Money position reportable to the CFTC and
- the Fibonacci fact that the rally from last Jun’s 1.3609 low came within half a penny of its (2.1315) 61.8% progression relationship to 2016’s preceding 0.8538 – 1.7647 rally on a weekly log scale basis below.
Clearly, commensurately larger-degree proof of strength below 07-Dec’s 1.8597 larger-degree corrective low and key risk parameter remains required to conclude a more significant peak/reversal-threat environment. We can’t conclude a larger-degree correction or reversal after just smaller-degree evidence of weakness. But if this setback is just of a smaller-degree nature, we have a tight but objective risk parameter at 2.1005 the market can recoup to reinforce a broader bullish count.
In sum, shorter-term traders have been advised to pare all bullish exposure and are further advised to consider a cautious bearish policy from 2.0500 OB with a recovery above 2.1005 required to negate this count and warrant its cover. We anticipate further correction to former Nov-Dec resistance from the 1.9650-area that, since broken in late-Dec has been rendered a new support candidate. Longer-term players are OK to pare bullish exposure to more conservative levels with commensurately larger-degree weakness below 1.8597 required to jettison the position altogether.
MAR RBOB
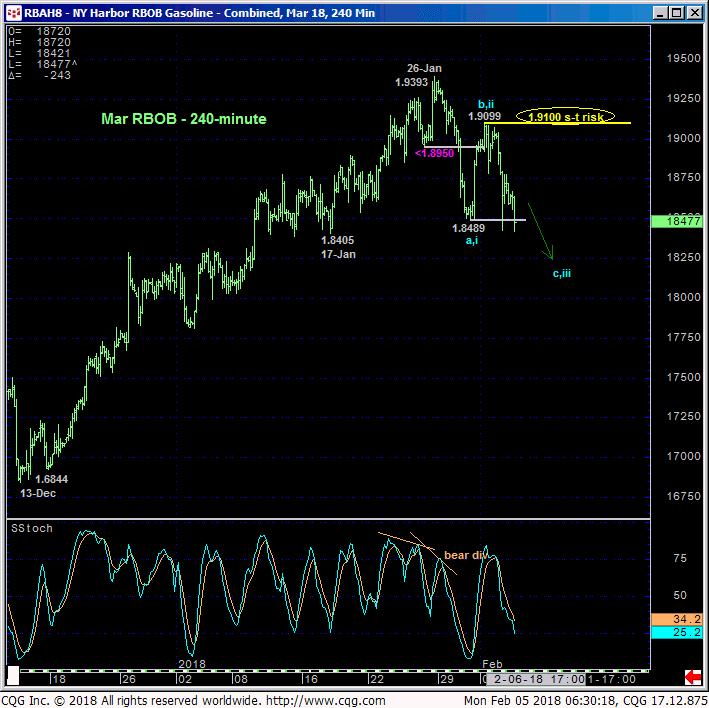
The technical construct and expectations for Mar RBOB are virtually identical to those detailed above for diesel with Thur’s 1.9099 the end of the latest smaller-degree corrective high the market is now minimally required to recoup to mitigate a larger-degree correction or reversal lower, render the sell-off from 26-Jan’s 1.9393 high a 3-wave and thus corrective affair and resurrect the secular advance. In this regard 1.9100 is considered our new short-term risk parameter from which non-bullish decisions like long-covers and cautious bearish punts from the 1.8500-area OB can be objectively based and managed.
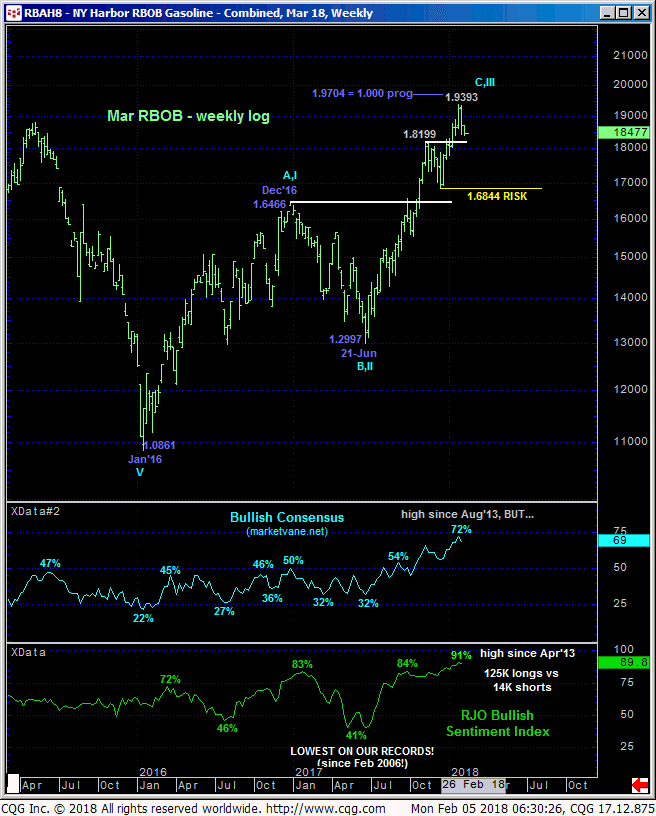
Former 1.8200-area resistance from early-Nov until late-Dec’s breakout is considered new support. A clear break below this area would be the next reinforcing evidence that 26-Jan’s 1.9393 high completed a 5-wave Elliott sequence from 21Jun17’s 1.2997 low ahead of a larger-degree correction that could easily span a couple months and reach the 1.65-area.
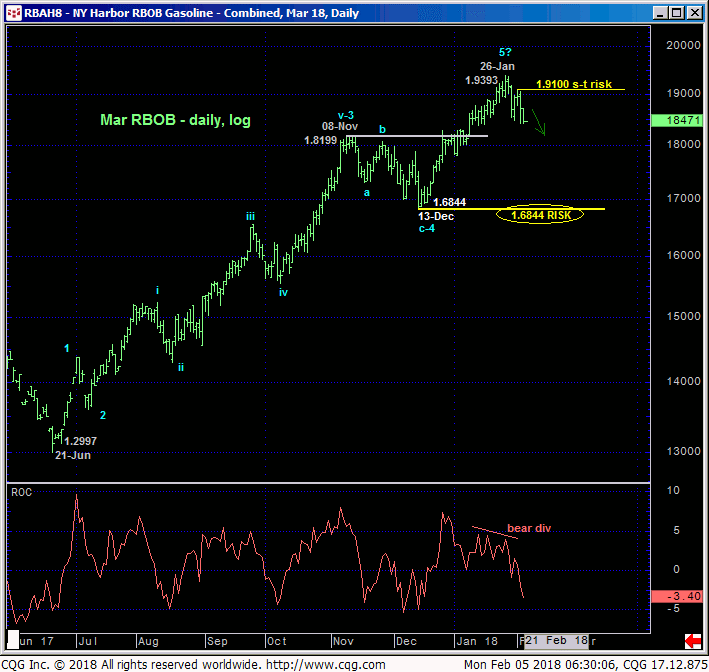
In sum, shorter-term traders are advised to move to a neutral-to-cautiously-bearish stance from 1.8500 OB with a recovery above 1.9100 negating this call, warranting its cover and re-exposing the secular bull. In lieu of such strength we anticipate further losses to the 1.8200-area, the break of which could extend those losses to the 1.68-to-1.65-range. Longer-term players are advised to pare bullish exposure to more conservative levels with a failure below 1.6844 still required to jettison the position altogether.
MAR CRUDE OIL
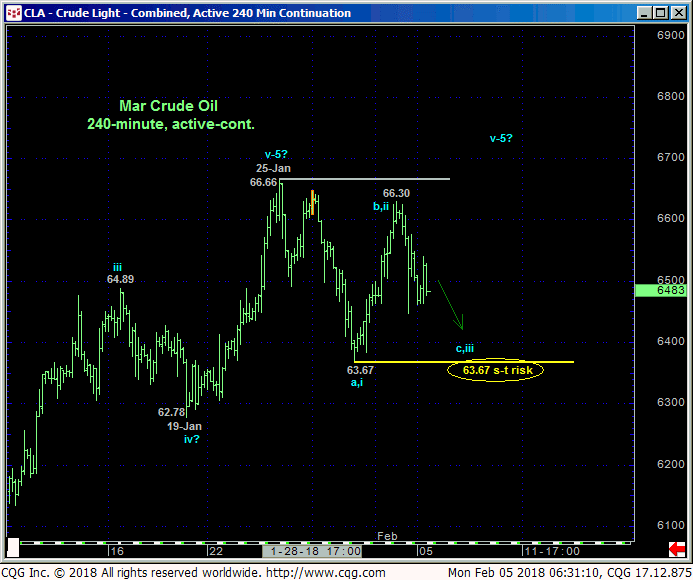
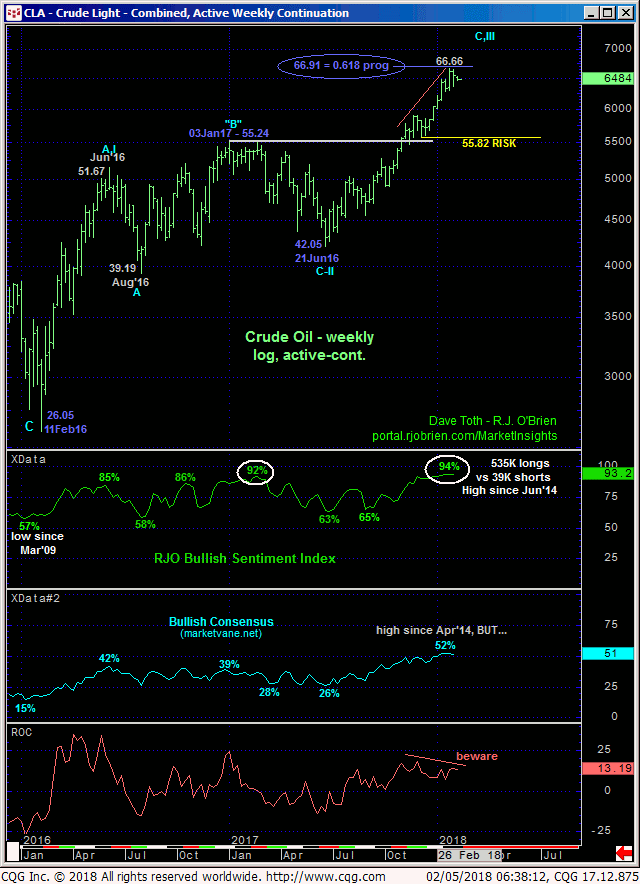
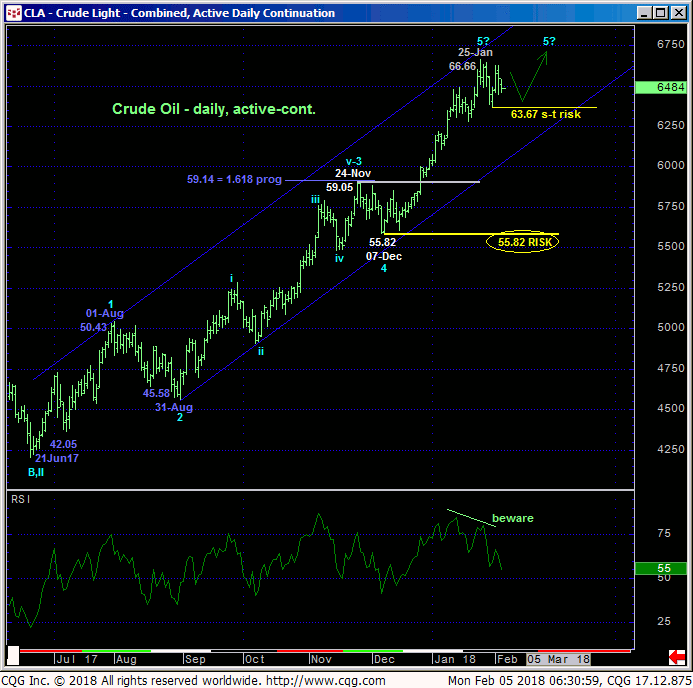
Unlike diesel and gas the 240-min chart above and daily chart below show Mar crude still just languishing around the middle of the past couple weeks’ range. A failure below 31-Jan’s 63.667 low and our new short-term risk parameter is required to confirm the same kind of bearish divergence in momentum that stemmed the rallies in the rest of the complex. In lieu of such sub-63.67 weakness it’d be premature to conclude a more significant correction or reversal lower.
Nonetheless, the ancillary peak/reversal-threat factors discussed above are also lying in the weeds in crude oil:
- an arguably complete 5-wave Elliott sequence from 21Jan17’s 42.05 low
- waning momentum (divergence confirmed below 63.67)
- historically frothy bullish sentiment not seen for nearly four years and
- the Fibonacci fact that the rally from last Jun’s 42.05 low came within a quarter of its (66.91) 0.618 progression relationship to 2016’s 26.05 – 55.24 rally on a weekly log scale basis below.
A bullish policy remains advised with a failure below 63.67 required for shorter-term traders to move to the sidelines and longer-term players to pare bullish exposure to more conservative levels. Needless to say a recovery above 25-Jan’s 66.66 high will mitigate any peak/reversal-threat concerns and reinstate the secular uptrend.
