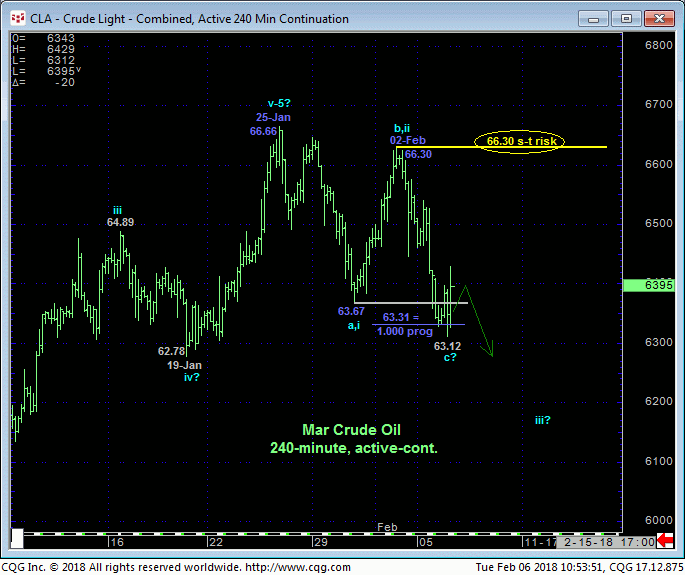
The market’s failure yesterday below 31-Jan’s 63.67 low and our short-term risk parameter confirms a bearish divergence in momentum and triggers a number of technical facts that warn of a peak/reversal threat that could be major in scope. The important by-product of this mo failure is the market’s definition of Fri’s 66.30 high as the latest smaller-degree corrective high this market is now required to recoup to render the sell-off attempt from 25-Jan’s 66.66 high a 3-wave and thus corrective affair, mitigate a bearish count and re-expose the secular uptrend. In lieu of such 66.30+ strength and for some very compelling reasons we’ll discuss below, the market could be vulnerable to extensive losses in the weeks and even months ahead. For these reasons we believe Fri’s 66.30 high is this market’s single most important technical level and condition.


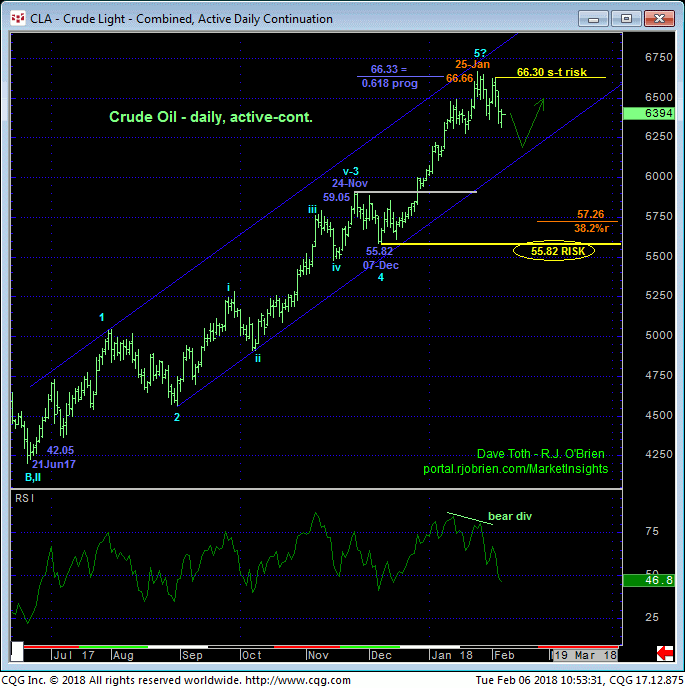
The daily chart above shows the bearish divergence in momentum stemming from yesterday’s break below 31-Jan’s 63.67 initial counter-trend low. Relative to the past seven months’ major uptrend, this momentum failure is hardly of a scale that would allow us to conclude the end of the major uptrend. However, the following facts and prospects are unique and compelling with respect to a peak/reversal count that could be major in scope.
These include:
- the prospect that 25-Jan’s 66.66 high COMPLETED a 5-wave Elliott sequence from 21Jun17’s 42.05 low as labeled
-
- the Fibonacci fact that the suspected 5th-Wave of this sequence from 07-Dec’s 55.82 low came within 33-cents of the (66.33) 0.618 progression of the net distance of Waves-1-thru-3 (42.05 – 59.05)
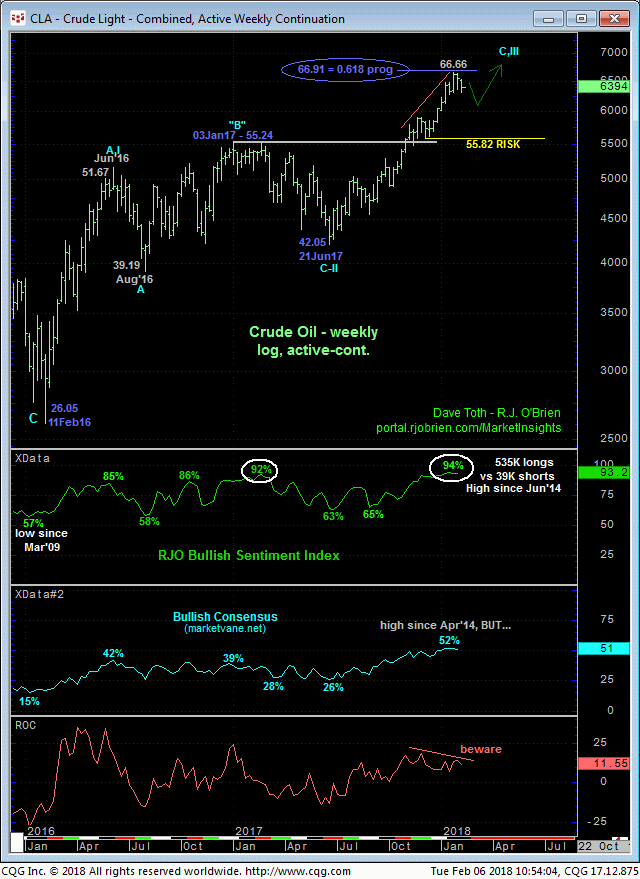
- the Fibonacci fact that the entire rally from Jun’17’s 42.05 low come within a quarter of its (66.91) 0.618 progression of 2016’s entire 26.05 – 55,24 rally shown in the weekly log chart below
- the fact that current sentiment/contrary opinion levels are at 3-1/2-YEAR highs that are typical of major peak/reversal-threat conditions.
Indeed, at a frothy 93% reading reflecting 535K Managed Money long positions to just 39K shorts, fuel for downside vulnerability is in ample supply.
IF these facts and prospects are indeed warning of a more protracted correction or reversal lower, then its incumbent on the bear to start to behave like one by 1) exhibiting sustained, impulsive price action lower and 2) NOT recovering above corrective highs like 66.30. Herein lies the crucial importance of Fri’s 66.30 corrective high as a risk parameter to a broader bearish possibility.
There is no way to speculate or forecast the market’s downside potential, but for the reasons cited above let’s just say it could be “substantial” (i.e. even a Fib minimum 38.2% retrace of Jun-Jan’s 42.05 – 66.66 rally doesn’t cut across until 57.26; and in terms of “time”, a 7-month rally could easily be corrected by a 2-to-3-month decline). But we can define with specificity where this market should NOT trade per any bearish count: above 66.30.
These issues considered traders are advised to move to a neutral-to-cautiously-bearish policy from current 64.00 levels OB with strength above 66.30 negating this call and re-exposing the secular bull. In lieu of such 66.30+ strength further and possibly extensive losses should not surprise.


