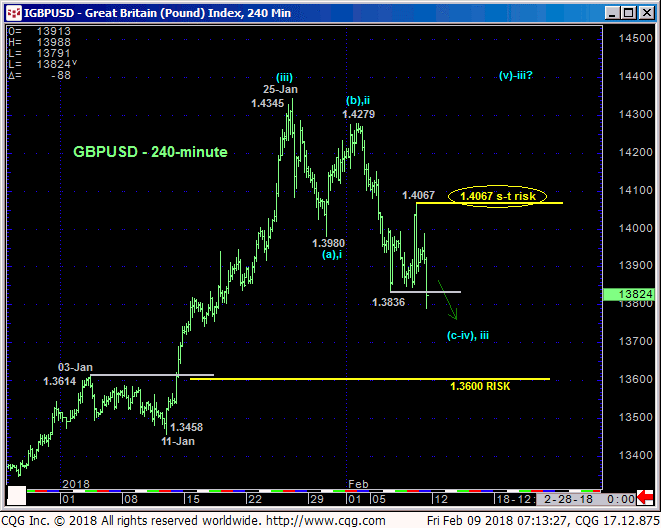
Today’s continued slide below Tue’s 1.3836 low leaves yesterday’s 1.4067 high in its wake as the latest smaller-degree corrective high the market is now required to sustain losses below to maintain a more immediate bearish count. In this regard that 1.4067 level is considered our new short-term risk parameter from which non-bullish decisions like long-covers and cautious bearish punts can be objectively rebased and managed.


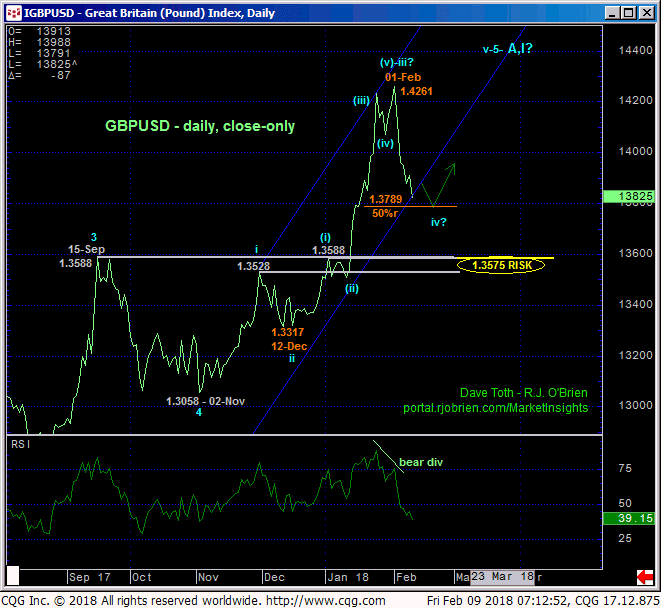
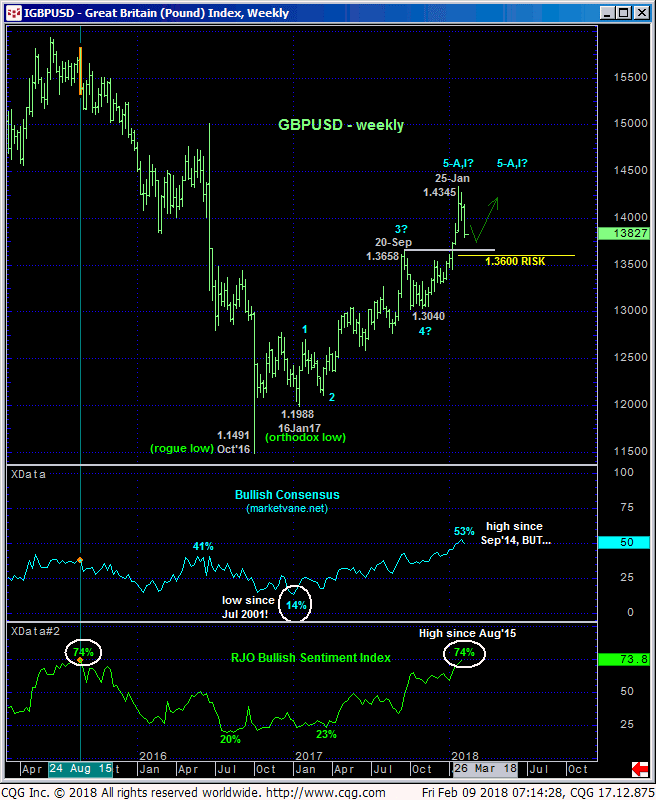
From a longer-term perspective the current challenge is one of determining what previous bull move the current relapse is correcting. The bearish divergence in momentum in the daily close-only chart is clear, exposing at least the intermediate-term trend as down. Thus far however this setback falls well within the bounds of a correction of just the portion of the bull from 12-Dec’s 1.3317 low close. The market is only now encroaching on the (1.3789) 50% retracement of this suspected 3rd-Wave component of the larger-degree 5th-Wave rally from 02-Nov’s 1.3058 low. The market also remains above a ton of former resistance-turned-support from the 1.3575 / 1.3600-area from the entire 4Q17 shown in both the daily close chart above and weekly chart below.
Now that the market has at least temporarily stemmed the uptrend and identified some highs and resistance however, currently frothy market sentiment/contrary opinion indicators can be considered applicable factors to a peak/reversal-threat environment that could be major in scope. Indeed, the current 74% reading in our RJO Bullish Sentiment Index of the hot Managed Money positions reportable to the CFTC is the highest in 2-1/2 years and clearly of a condition that could fuel much more extensive downside vulnerability. This said however, only a glance at the weekly chart below is needed to see the pertinence of the 1.3600-area as a key support candidate and a commensurately larger-degree risk parameter the market needs to break to threaten the past YEAR’S uptrend.

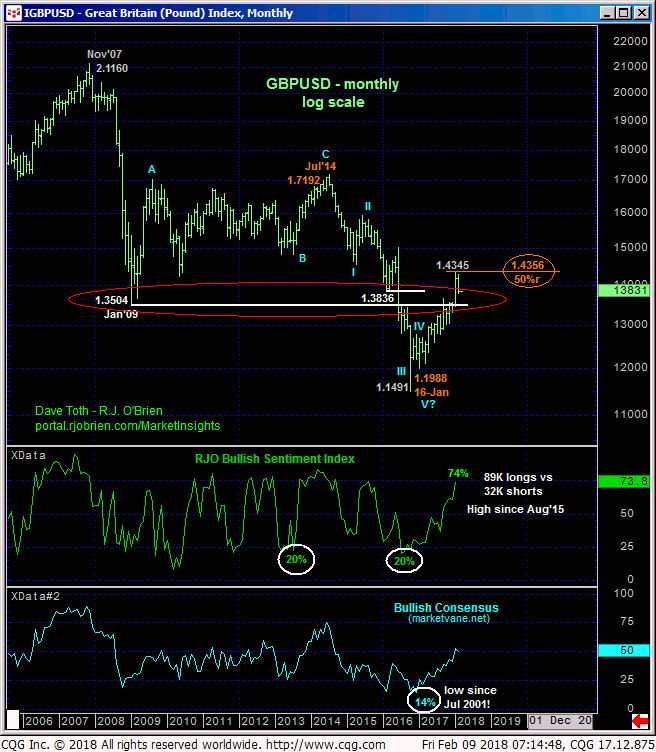
On an even longer-term basis, the monthly log scale chart below shows the market’s failure last month to sustain 2016’s losses below a HUGE area of former support from the 1.35-to-1.38-range that should have provided resistance. This is a very long-term positive development. But now that the market has provided at least some semblance of a relapse that rejects/defines some reliable highs and resistance, the fact that 25-Jan’s 1.4345 high was virtually the exact 50% retrace of the major downtrend from Jul’14’s 1.7192 high to Jan’16’s 1.1988 orthodox low provides an interesting footnote to a peak/reversal-threat environment.
These issues considered, a neutral-to-cautiously-bearish policy remains OK for shorter-term traders with a recovery above 1.4067 required to stem the slide and expose at least a rebutting correction higher and possibly a resumption of the new secular bull trend. Long-term players remain advised to maintain a cautious bullish policy with a break below the 1.3600-to-1.3575-range required to negate this call, warrant its cover and expose what then could be months of correction lower. In effect we believe the market has identified 1.4067 and the 1.3600-area as the key directional triggers heading forward.


