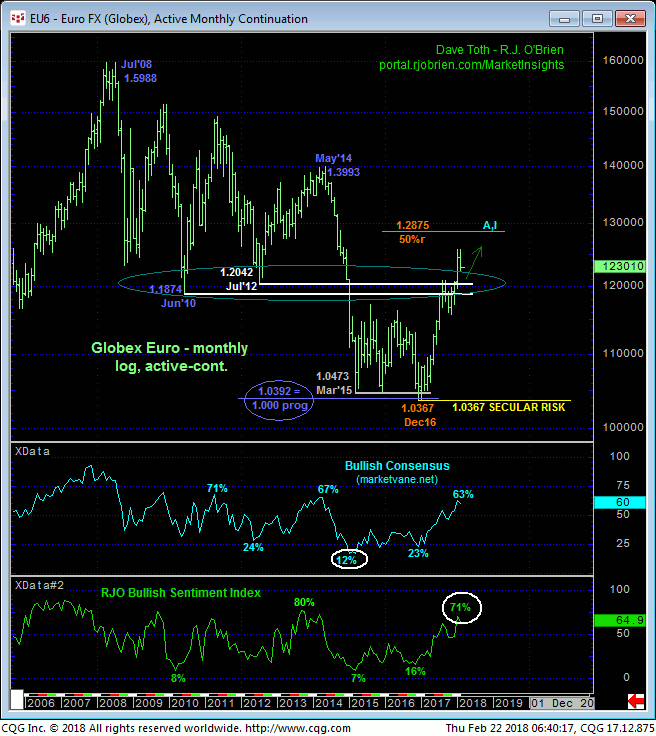
Starting from a very long-term perspective, the extent and impulsiveness of the past 13-month rally remains consistent with our count calling 15Dec16’s 1.0367 low the END of the secular bear market from 2008’s 1.5988 high and start of a new secular bull market. This said, and just like with 2008’s initial counter-trend decline that was rebutted by an extensive 13-month, 77% correction before the major reversal resumed, a similar corrective rebuttal to the rally from Jan’17’s low should not come as a surprise within the context of a massive, multi-year base/reversal PROCESS.

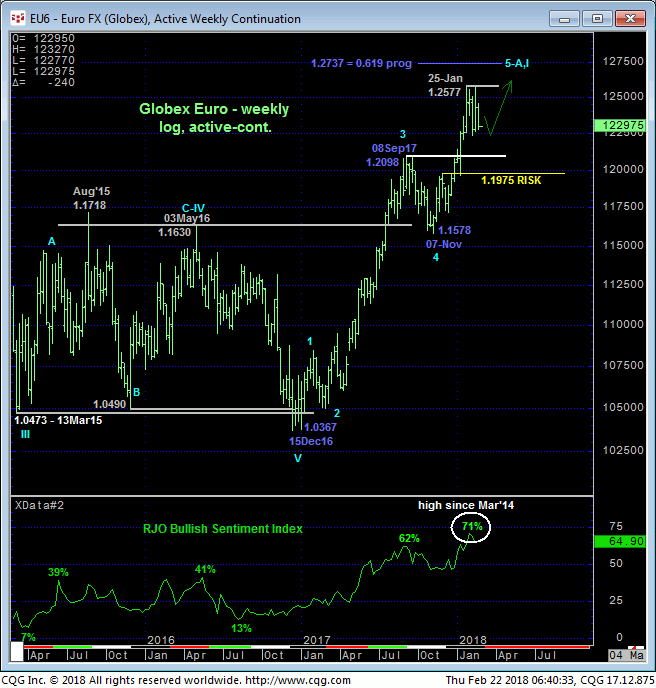
The weekly log scale chart below details the impressive 13-month rally from Dec’16’s 1.0367 low. On this scale commensurately larger-degree weakness below at least former 1.2098-area resistance-turned-support from last Sep and specifically below 27-Nov’s 1.1975 smaller-degree 1st-Wave high of the Elliott sequence up from 07-Nov’s 1.1578 low is required to threaten the uptrend. Against this backdrop the past month’s lateral chop falls well within the bounds of a mere correction ahead of an eventual resumption of the broader bull.
Traders will also notice the return to historically frothy levels in market sentiment in the weekly chart below and monthly chart above that warn of interim downside vulnerability that, again, should hardly come as a surprise within a multi-year base/reversal process. But traders are reminded that sentiment is not an applicable technical indicator in the absence of a confirmed bearish divergence in momentum of a scale sufficient to break or even threaten the clear and present uptrend.

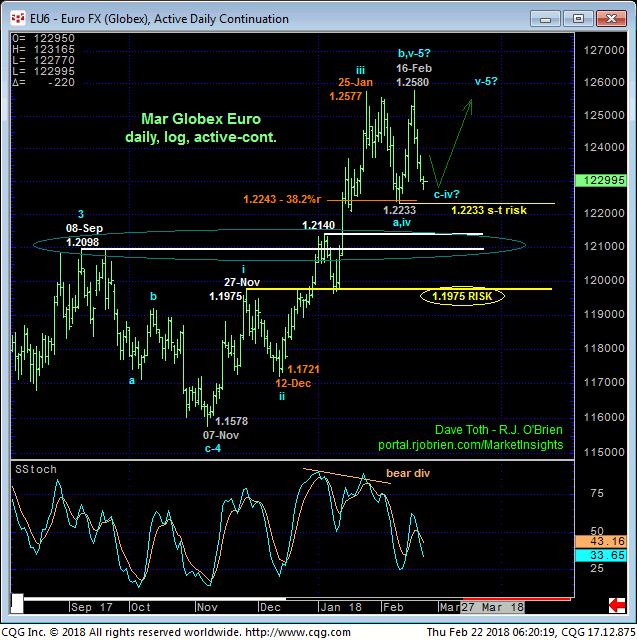
On a more practical scale shown in the daily log chart below, the current challenge we’re facing is whether the rally from 09-Feb’s 1.2233 low to 16-Feb’s 1.2580 high is the completing 5th-Wave of an Elliott sequence from 07-Nov’s 1.1578 low or just a b-Wave within a 4th-Wave correction down from 25-Jan’s 1.2577 high. We have highlighted that 1.2233 low as our short-term risk parameter to a still-advised bullish policy and exposure as there’s no way to really know what lies below that point. What we DO know is that the sell-off attempt from 25-Jan’s 1.2577 high has thus far only retraced a Fibonacci minimum 38.2% of the suspected 3rd-Wave rally from 12-Dec’s 1.1721 low. Especially against the backdrop of the broader 13-month uptrend, this fact compels us to bias towards a count that contends the past month’s price action is merely (4th-Wave) corrective/consolidative ahead of at least one final (5th-Wave) spike to new highs above 1.2580.
A break below 1.2233 will not necessarily negate this longer-term bullish count, but defensive action is required below that point nonetheless because of technical and trading discipline. If our still-bullish count is wrong and the rally has ended, then such a break should be followed by sustained, impulsive behavior down. A BULLISH divergence in short-term momentum thereafter will be the first sign of the resumed bull and we’ll just have to chalk up the loss to whipsaw risk.

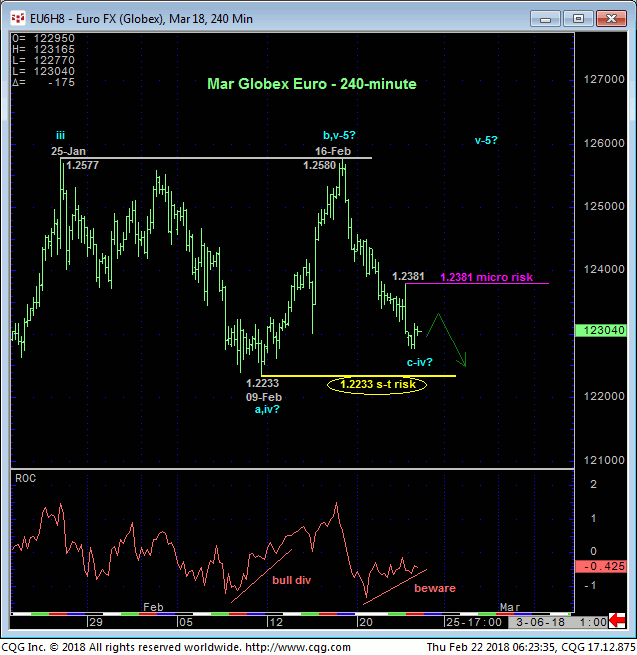
Drilling down even more to an intra-day basis, the 240-min chart below shows the market’s return to the extreme lower recesses of the past month’s range. If a broader bullish count is still what the market has in store, then we would expect it to indicate some “non-weakness” somewhere around here with a bullish divergence in very short-term momentum. As a result of yesterday afternoon and overnight’s resumed slide, this chart shows that the market has defined yesterday afternoon’s 1.2381 high as a very minor corrective high and a micro risk parameter around which scalpers will be able to negotiate not only a prospective base/reversal to the relapse from 16-Feb’s 1.2580 high, but also a possible resumption of the secular bull to new highs above 1.2580.
These issues considered, a bullish policy remains advised with a failure below 1.2233 required to threaten this call enough for shorter-term traders to move to the sidelines. In lieu of such sub-1.2233 weakness and especially if the market recovers above 1.2381, we anticipate a resumption of the major uptrend to new highs above 1.2580. A bullish policy remains advised for long-term players with a failure below 1.1975 required to negate this call and warrant its cover.


