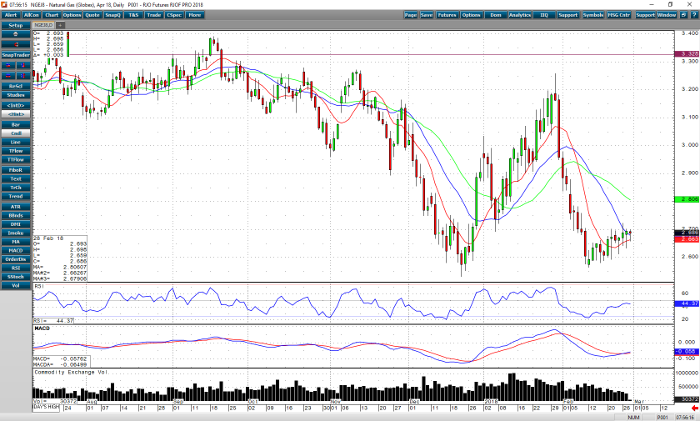
Good morning all. The overall trend on a daily chart is slightly up to neutral. After the wild ride three weeks ago, prices are starting to trade in a more normal range. We are starting to get into that no man’s land between the heating and peak cooling seasons. We’ve been constrained within a 10 cent trading range, and don’t expect to see any larger moves unless there is some kind extreme weather or supply disruption. A close below 2.600 would be a precursor to a selloff, and a close above Monday’s high of 2.723 may signal the move to the next higher range. Momentum studies are at mid-levels and aren’t really helping much as a directional indicator.
This week’s storage number expects to see a -71bcf draw, as opposed to an average draw of -120bcf. Forecasts are calling for seasonal temperature’s over the next week, and above average the first week of March. A strong dollar is loosening the bulls grip on the market, the smaller than usual draw, and warmer weather may have enough impact on the trend to take the market under 2.600. I’d like exposure to short side of the market barring any unseen events slowing supply. Put options are the least risky, but I’d also consider a short with a protective stop above Monday’s high.
Natural Gas Apr ’18 Daily Chart


