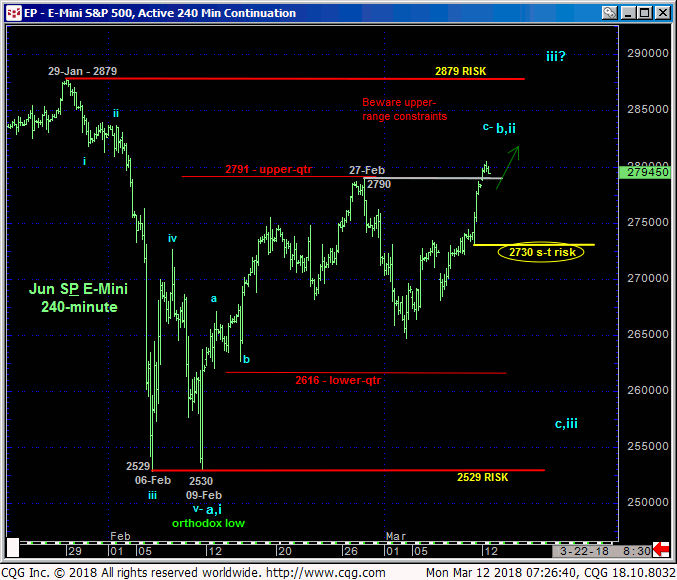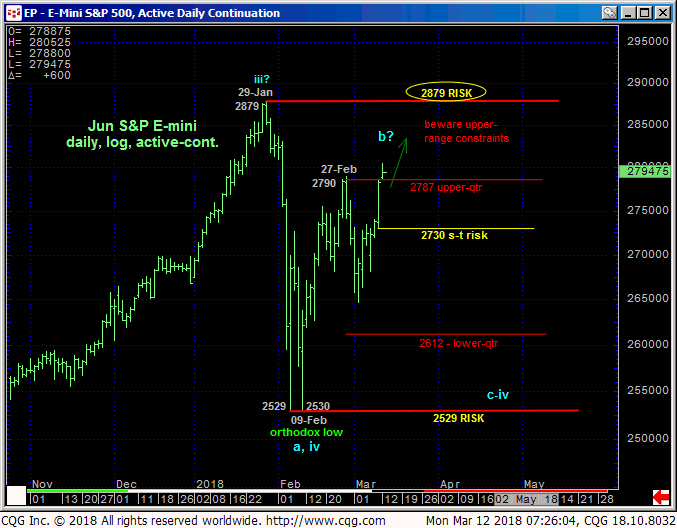
Overnight’s recovery above 27-Feb’s 2790 high and our short-term risk parameter mitigates our specific call in 02-Mar’s technical Blog for further lateral-to-lower consolidation within the broader range between 29-Jan’s 2879 all-time high and 09-Feb’s 2530 orthodox low. As a direct result of this resumption of the second-half of Feb’s uptrend, the 240-min chart below shows that that the market has defined Fri’s 2730 low as the latest smaller-degree corrective low that the bull now needs to sustain gains above to maintain a more immediate bullish count. Per such this 2730 level is considered our new short-term risk parameter from which non-bearish decisions like short-covers and cautious bullish punts can be objectively based and managed.

This tighter but objective risk parameter at 2730 may come in handy given that the market has only encroached upon the upper-quarter of the past month-and-a-half’s range, presenting a slippery slope for bulls “up here”. Indeed, while 29-Jan’s 2879 high and key risk parameter remains intact as a resistant cap, we cannot ignore the prospect for another intra-range (c-Wave) swoon to its lower-quarter to complete the correction before the next leg of the secular bull.

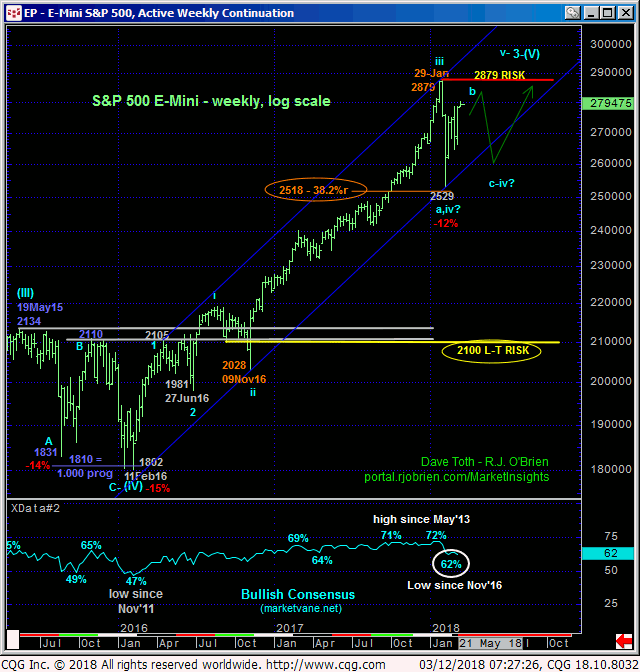
While we do not believe the correction down from 29-Jan’s 2879 high to be as large as that that unfolded from May’15’s 2134 high to Feb’16’s 1802 low shown in the bottom-left corner of the weekly log chart below, that correction may serve as a good proxy for the current one. And that correction shows the intra-range (B-Wave) correction coming within a mere 24-pts of the 2134 start of the correction before the (C-Wave) bottom fell out and set up the next incredible buying opportunity.
IF 09-Feb’s 2530 low completed the correction, then it absolutely is incumbent on the bull to BEHAVE LIKE ONE with trendy, impulsive behavior up through late-Jan’s 2879 high. A smaller-degree bearish divergence in momentum from the upper-quarter of the range in question will be the first indication that there may be more- and likely more “emotional”- correction to come. Currently, Fri’s 2730 low provides THE level and risk parameter around which we’ll make this decisions. The market may be accommodative “up here” in the week ahead to provide an even tighter level around which to make this judgment.

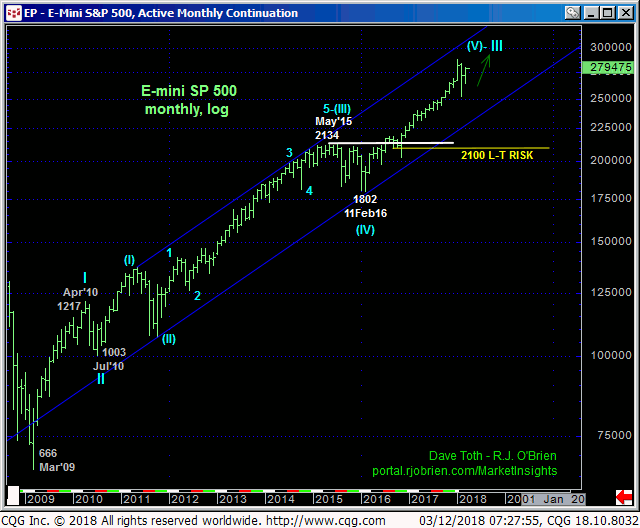
Whether we get another intra-range relapse or not, the extent of Jan-Feb’s sell-off attempt falls well within the bounds of another mere correction within the secular bull market on a long-term monthly log scale basis below. Again, to do any damage to the secular bull, the market is MINIMALLY required to fail below the key area of former 2100-area resistance-turned-support.
These issues considered, a neutral/sideline policy is advised for the time being as we believe the risk/reward merits of initiating bullish exposure “up here” are poor.


