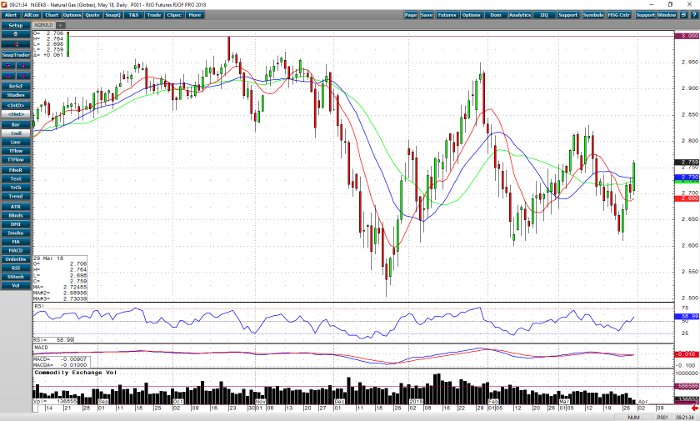
Natural gas is riding a four-day uptrend. Nearby support is at 2.600-2.610. After that, December’s low of 2.504 is long-term support. 2.831 is resistance. A close above the resistance number could signal a run to the January highs of 2.951. RSI and MACD are trending up and could help a move to the upside. A close below 2.600 will may signal a selloff to the previous lows, sub 2.500 can be a realistic target.
The near-term forecast is for cool weather, but spring time signals for less heating demand. Demand for electricity for cooling still hasn’t kicked in. So, the bulls will have some other news to keep grip on the market. Funds have a good size net long position, so before the demand decreases for heating, they might want to take profits. A draw of -75 bcf is expected. This is slightly larger then average and may support the market today. The 5-year average is closer to -50 bcf. Going into the long Easter weekend, I’d be cautiously long today.
Natural Gas May ’18 Daily Chart


