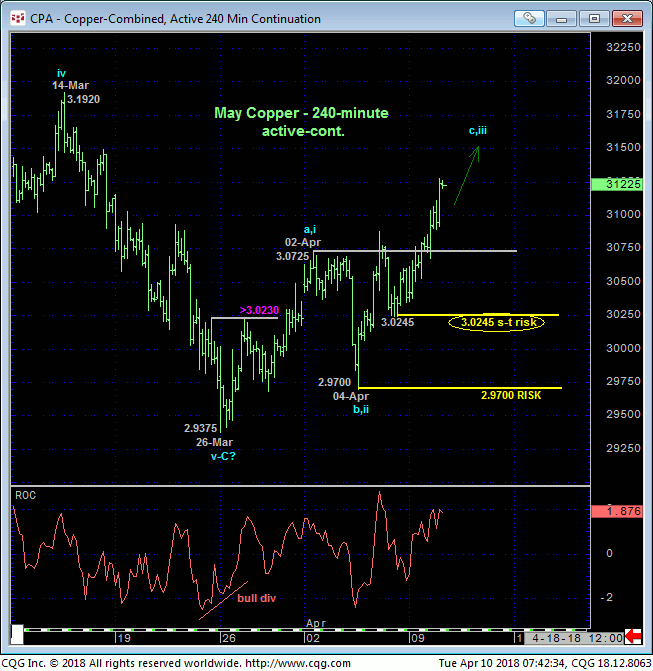
In 27-Mar’s Technical Blog we discussed the developing threats to the major uptrend as well as a very short-term, nondescript show of strength above 23-Mar’s 3.0230 minor corrective high. After further gains and a relapse attempt, this week’s recovery above 02-Apr’s 3.0725 initial counter-trend high not only confirms at least the intermediate-term trend as up, we believe the long-term directional scale has tilted back in favor of the secular bull.
By virtue of this week’s resumed uptrend, the 240-min chart below shows that the market has identified Fri’s 3.0245 low and 04-Apr’s 2.9700 low as the latest smaller- and larger-degree corrective lows. In light of broader bullish evidence we’ll elaborate on below, traders are advised to use these two levels are our new short- and longer-term parameters from which to rebase and manage the risk of a resumed bullish policy.
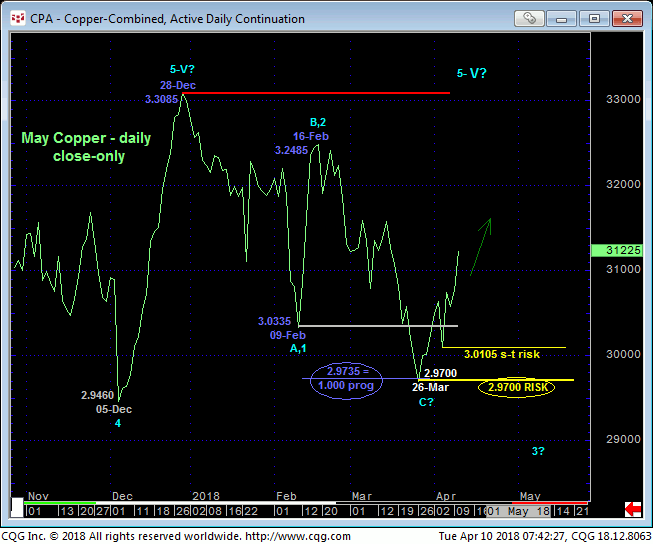
Integral to a resumed long-term bullish count are the following:
- the clear 3-wave and this corrective decline from 28-Dec’s 3.3085 high close to 26-Mar’s 2.9700 low on a daily close-only basis above
-
- the Fibonacci fact that the (prospective C-Wave) decline from 16-Feb’s 3.2485 high came within a third of a penny of equaling (i.e. 1.000 progression) Dec-Feb’s initial (A-Wave) decline from 3.3085 to 3.0335
- the bear’s gross failure to “perform” below early-Feb’s 3.0260 low when it had every chance in the world to do so with late-Mar’s break
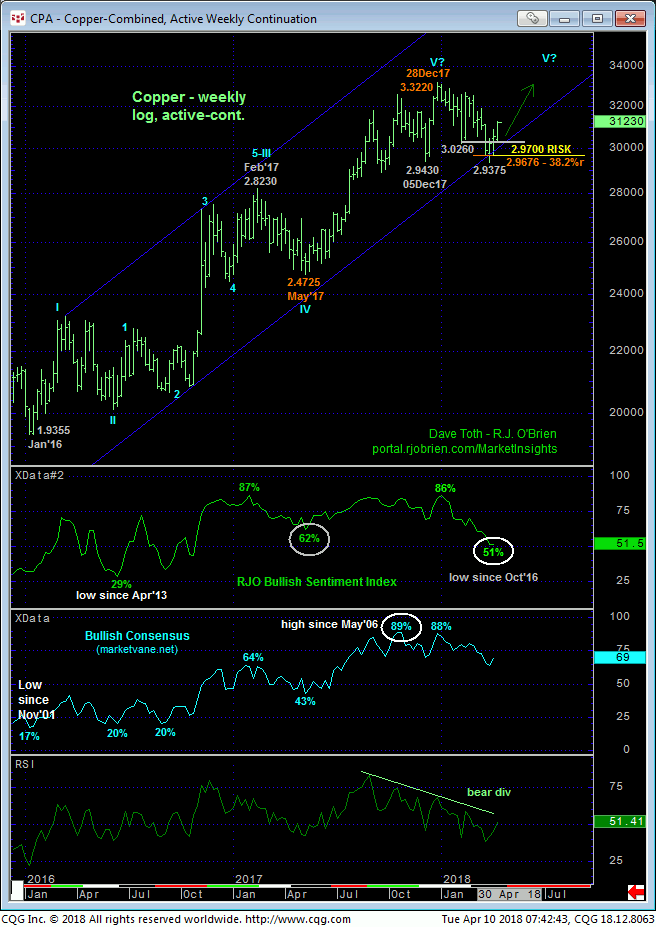
- the market’s inability to correct/retrace much more than a Fibonacci minimum 38.2% of May-Dec’17’s 2.4725 – 3.3220 rally
- the return to relatively low bullish sentiment levels that have warned of and accompanied other corrective ends within the major two-year bull.
Indeed, at a current 51% reading our RJO Bullish Sentiment Index of the hot Managed Money positions reportable to the CFTC is at its lowest, least-bullish level since Oct 2016 when the market exploded higher.
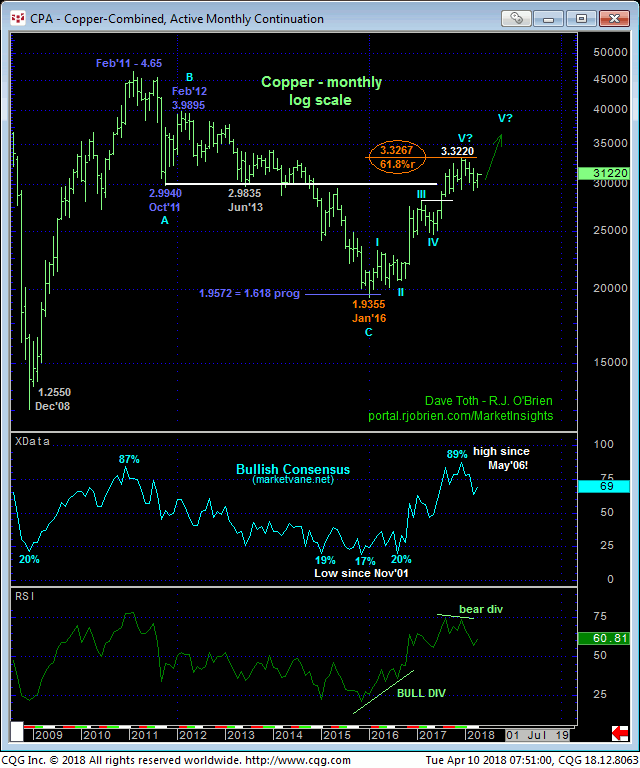
On an even broader monthly log scale below, it’s hard to ignore the fact that the major 2-year bull has thus far stalled within spittin’ distance of the (3.3267) 61.8% retrace of the entire secular bear market from Feb’11’s 4.65 high to Jan’16’s 1.9355 low. However, on this scale the market has NOT yet provided the evidence to suggest the long-term uptrend is over. As a result of the past couple weeks’ rebound, minimally, a relapse below 26-Mar’s 2.9700 low close is required to mitigate a resumed bullish count and resurrect a peak/reversal count that could be major in scope. In lieu of such weakness and given the backdrop of the still-arguable TWO-YEAR uptrend, traders are advised to return to a bullish policy and first approach setback attempts to former 3.0750-area resistance-turned-support as corrective buying opportunities ahead of a resumption of the secular bull to new highs above 3.3220. A failure below 3.0245 would suffice in warranting the cover of this exposure.
