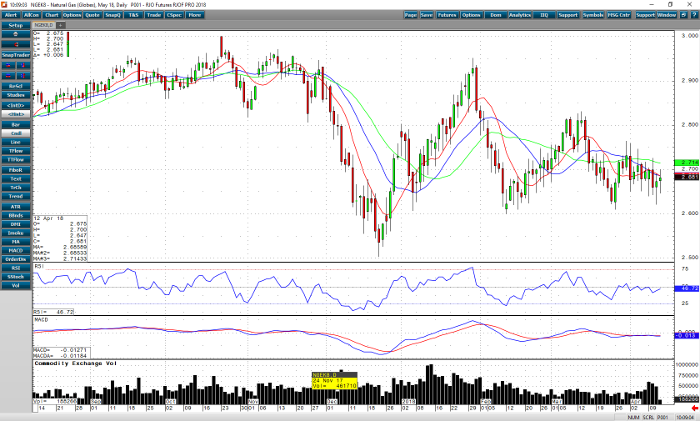
The trend in May natural gas is down. It has been trading in a consolidation over the last week to week and a half. The market is supported between 2.650 down to 2.600. Above 2.700 may turn the tide back to the bulls. Above the April 4 high of 2.746 should signal a charge toward the 2.800 mark, and finally above the March 13 high of 2.831 might see a run to a target in the 2.900’s. All momentum studies are at mid-levels and moving sideways. We are still waiting for a divergence to signal a directional move.
Weather has been starting to warm up. This year has started out below normal temperatures up until now. This week the forecast is calling for more seasonal temps. Some 60’s and 70’s temperatures will be seen in the Midwest. The last snows might have fallen for this year and spring will finally arrive, after one more cold spell early next week. A slightly larger draw of -19 bcf was realized this week after the estimates called for -11 bcf. The 5-year average is a slight surplus of 9 bcf. I suggest further exposure to the short side until we see something material to change the current trend.
Natural Gas May ’18 Daily Chart


