In the early morning trade, June gold is slightly in the negative and trading at $1,340.4. After President Trump didn’t retaliate against the Assad Regime in Syria for gassing his own people earlier in the week, gold has fallen nearly $35 off its April 11th high of $1,369.4. After the big three day drop in gold and the overnight rhetoric out of Russia that war cannot be ruled out, there is a good chance that gold can find some support down at these levels. Furthermore, with all these geopolitical headlines, I find it very hard for traders/investors to want or feel comfortable going home short over the weekend as anything can unfold from this situation. Lastly, Chinese investors have been rushing to buy gold ETF’s, which will obviously be seen as a positive for gold bulls.
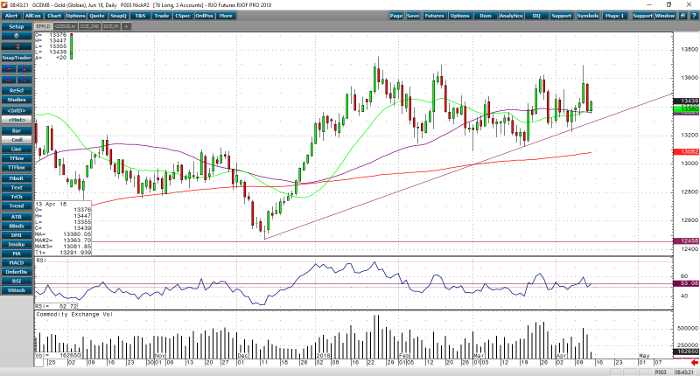
If we take a quick look at the daily June gold chart, you’ll see that gold found support around its 20- and 50-day moving averages, which come into play at $1,338.0 and $1,336.4. If it fails to hold these, then look for a pull back to last week’s low of $1,322.60. If all hell breaks out today, over the weekend, or soon with the Syria conflict, then look for a rally back to at least this week’s high or much higher.
Gold Jun ’18 Daily Chart


