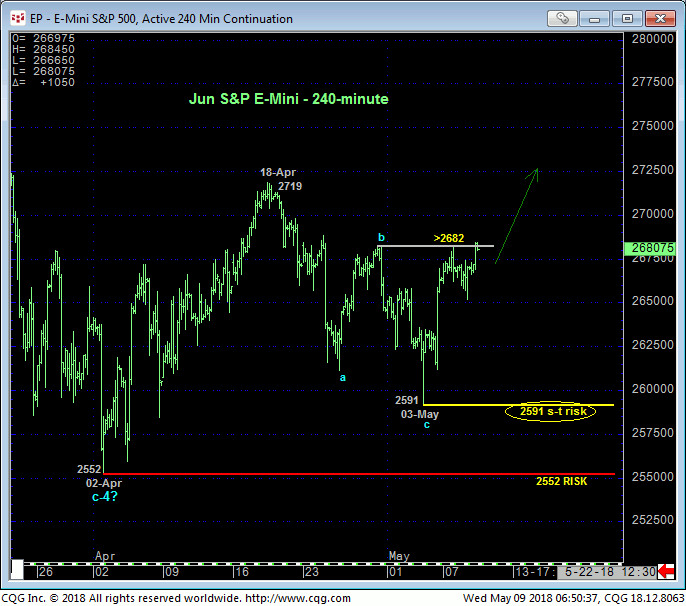
Overnight’s recovery, as scant as it is, above 30-Apr’s 2682 high and our short-term risk parameter discussed in Fri’s Technical Blog renders the recent setback from 18-Apr’s 719 high to Thur’s 2591 low a 3-wave affair as labeled in the 240-min chart below. Left unaltered by a relapse below that 2591 low, this 3-wave decline is considered a corrective/consolidative event that warns of a resumption of early-Apr’s 2552 – 2719-rally that preceded it. In this regard that 2591 low serves as our new short-term parameter from which the risk of non-bearish decisions like short-covers and cautious bullish punts can be objectively based and managed.


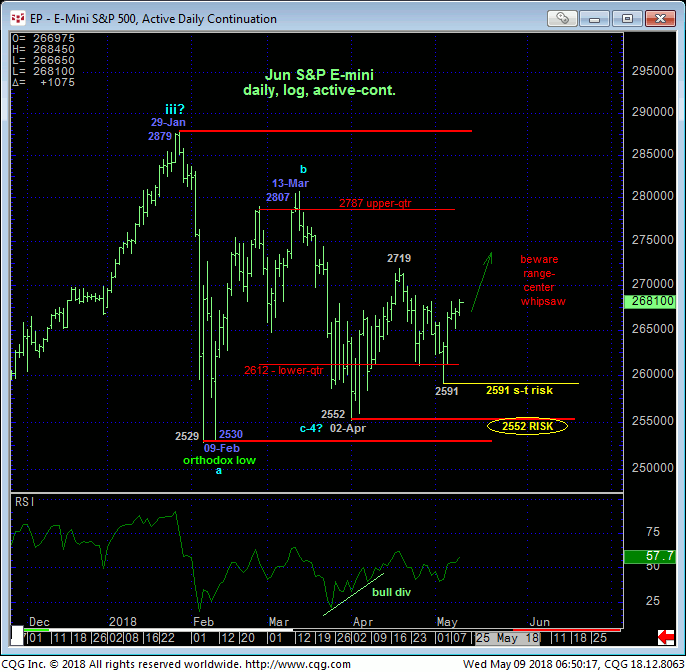
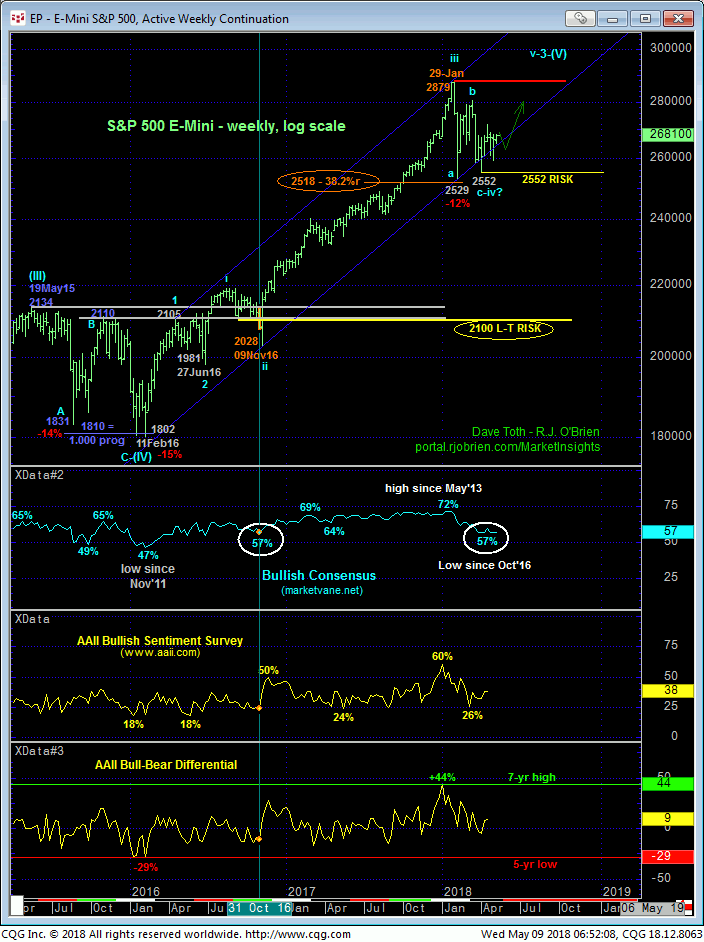
If there’s a “but” to the bullish equation, it’s the fact that the market has only returned to the middle-half bowels of the lateral range that has engulfed it since 29-Jan’s 2879 high. Against the backdrop of the secular bull market shown in the weekly log scale chart below, this lateral chop is advised to first be approached as just a correction within the secular uptrend that’s expected to resume. How long the market chops everyone up within this consolidation is anyone’s guess. And to be sure, the middle-halves of such ranges are typically rife with aimless whipsaw risk and present poor risk/reward merits from which to initiate directional exposure.
A bullish policy and exposure remain advised for long-term players with a failure below at least last week’s 2591 corrective low required to pare bullish exposure and subsequent weakness below 02-Apr’s 2552 next larger-degree corrective low and key risk parameter required to threaten a bullish call enough to warrant moving to the sidelines to circumvent the depths unknown of a larger-degree correction or perhaps even a major peak/reversal environment. Until and unless such sub-2552 weakness is proven, the:
- backdrop of the secular uptrend
- fact that the past quarter’s sell-off attempt failed to retrace even a Fibonacci minimum 38.2% of even Nov’16 – Jan’17’s 2028 – 2879-portion of the bull AND, most importantly,
- erosion in bullish sentiment to levels that have warned of and accompanied previous ENDS of corrections for YEARS
would seem to be consistent with a count calling for an eventual resumption of the secular bull to new all-time highs above 2879. If this bullish count is wrong, all the bear has to do is fail below at least 2591 and then 2552.

These issues considered, a bullish policy and exposure remain advised for long-term players with a failure below 2552 required to move to the sidelines. Shorter-term traders with tighter risk profiles are advised to move to a neutral/sideline position. The risk/reward merits of initiating directional exposure from the middle of the past quarter’s range are too poor to make a bullish bet here around 2679.

