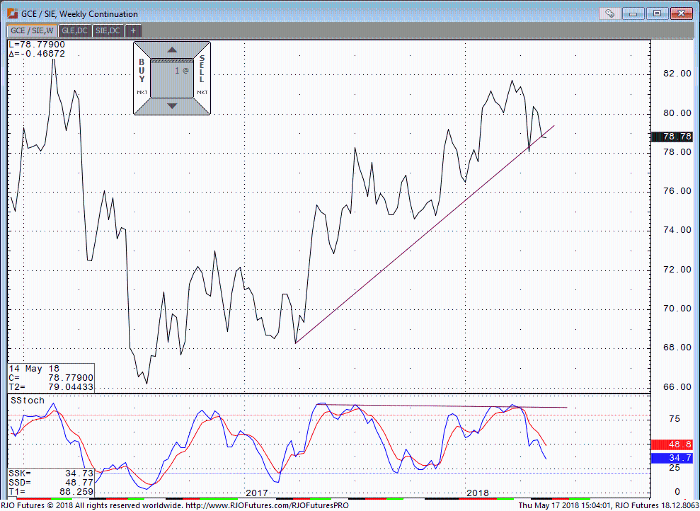
July silver is holding above 16.00 this week, currently trading at 16.425, down about 5 cents on the day. The 4hr chart for July silver is in a “bear- flag” type of chart formation and suggest that these levels may not hold for long, sending silver below 16.00. The US dollar is very strong once more this morning. Pulling up a monthly chart in the US dollar will quickly assure you that the bull camp has the technical advantage. Headline news such as a possible summit with Pyongyang and trade talk with China and the European union are positive to the US dollar. One thing is certain, despite recent weakness in metals, silver is stronger than gold. I periodically visit the gold/silver ratio, the chart below suggests that silver is becoming more favorable over gold. In other words, gold is expensive! The ratio is hovering around 80.00. In my view, a reading above 80.00 makes silver cheap and below 60.00 makes gold cheaper from a historical perspective.
Again, the technical outlook for silver is that it is up at least from the monthly low of 16.07 made May 1, 2018, but overall, it’s trending down. If price breach the 16.20 level again, per-close bases, could result in selloff to the 16.00 psychological level. If pressed below 16.00, you might see a low 15.80 or even lower. So, all that said, a trade over 16.70 is needed to put near-term lows in.
Gold/Silver Ratio Weekly Chart


