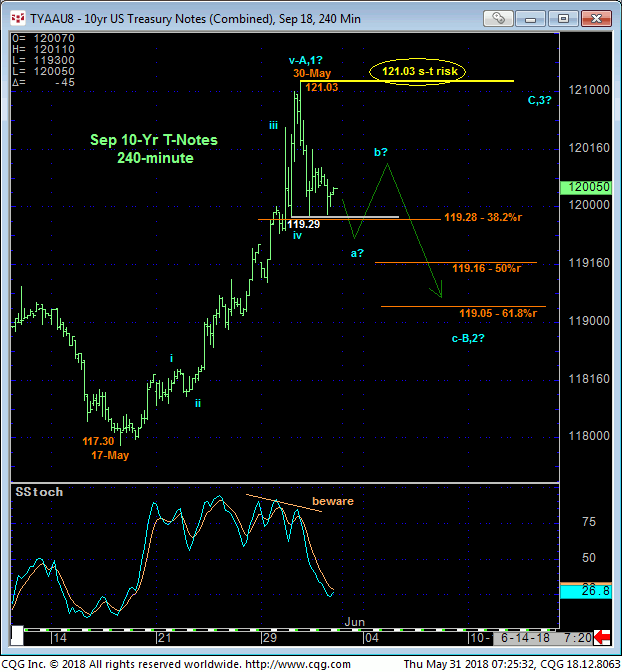
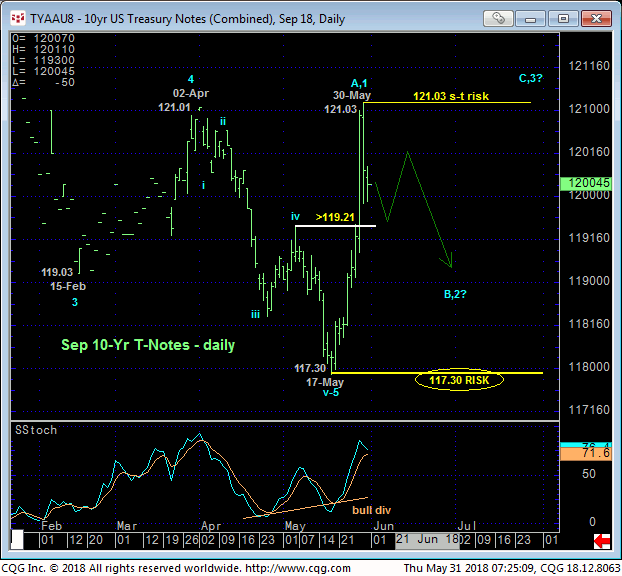
While the now-prompt Sep contract has yet to confirm a bearish divergence in short-term momentum below a smaller-degree corrective low on Tue at 119.29, we believe that yesterday’s 121.03 high completed a 5-wave Elliott sequence from 17-May’s 117.30 low as labeled in the 240-min chart below. The developing potential for a bearish divergence in momentum is clear (confirmed below 119.29) while it would also be quite unusual for such an initial counter-trend rally to simply keep going in the face of what has been an arguable secular downtrend.
The extent and impulsiveness of this month’s rebound is not unimpressive and suggests that it’s only the initial A- or 1st-Wave of a more protracted correction or reversal higher in the weeks and perhaps months ahead. But within such a broader base/correction/reversal-threat process we strongly suspect an interim (B- or 2nd-Wave) rebuttal that could be extensive in terms of both price and time. Within the context of a secular bear market and given the extent and uninterrupted nature of this month’s spasm higher, such a corrective relapse could easily retrace 61.8% or more of the 117.30 – 121.03 rally to the 119.05-area or lower.


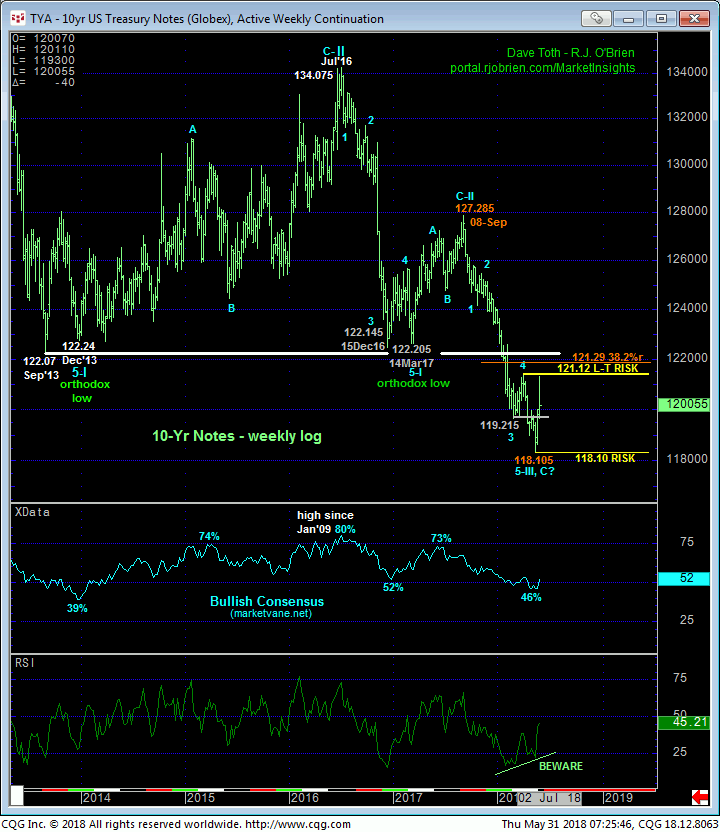
In recent blog updates we’ve discussed the prospect that 17-May’s 118.105 low in the then-prompt Jun contract completed a major 5-wave Elliott decline from 08Sep17’s 127.285 high as labeled in the weekly log active-continuation chart below. The developing POTENTIAL for a bullish divergence in WEEKLY momentum along with a return to historically low sentiment levels would seem to reinforce this count that could easily expose a multi-month corrective rebound. And as a result of the extent and impulsiveness of the past half-month’s rally, 17-May’s 117.30 low in the Sep contract now serves as our key long-term risk parameter the market is required to break to negate this count and reinstate the secular bear. In lieu of such sub-117.30 weakness setback attempts are advised to first be approached as corrective buying opportunities by longer-term players.
Against the backdrop of a secular bear market however, a rebutting (B- or 2nd-Wave) correction of this month’s sharp rally would be typical within the context of a broader base/correction/reversal PROCESS. And such a corrective rebuttal could be extensive, retracing 61.8% (to 119.05-area) or more.

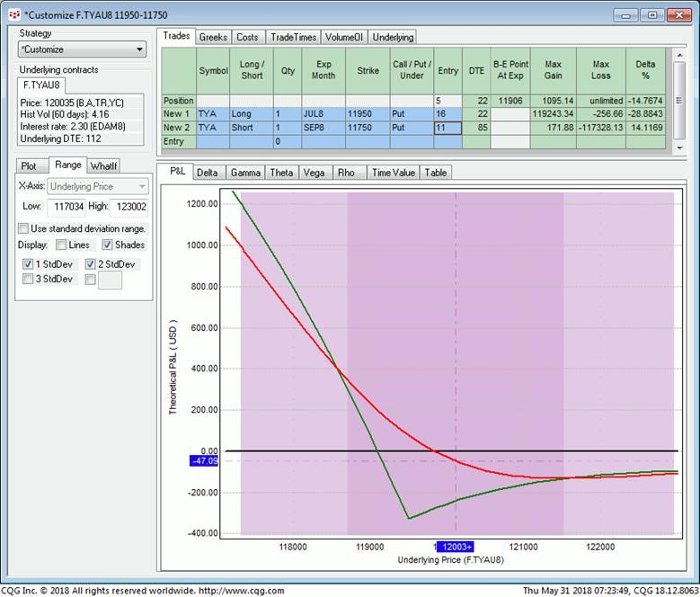
With tomorrow’s Jun unemployment data easily capable of being a catalyst for “movement”, traders are advised to consider the Jul 119-1/2 – Sep 117-1/2 Put Diagonal Spread as a cautious but favorable risk/reward way to position for an interim corrective setback over the next couple weeks. This strategy involves buying 1-unit of the Jul 119-1/2 Puts around 16/64s and selling 1-unit of the Sep 117-1/2 Puts around 11/64s for a net cost of 5/64s ($78.12 per 1-lot position). This strategy provides:
- a current net delta of -0.29
- enviable 3:1 gamma ratio
- negligible risk if we’re wrong on direction and market explodes higher (so you can sleep tonight)
- profit potential of nearly two full points ($1,921) on a sustained resumption of the secular bear trend.
Most applicably, this strategy provides a very cautious and low-cost way to get long the 119-1/2 puts that could morph into an aggressive bearish position in the underlying contract on a surprise move lower as a result of tomorrow’s unemployment report. This gamma advantage results from the huge discrepancy in the remaining days to expiration between these two options (22 days vs 85 days). This gamma advantage comes in exchange for time decay risk, or theta. But with three weeks to expiration of the Jul options, the market will have plenty of time to show its directional hand before the risk of the higher-theta Jul 119-1/2 puts becomes an issue.
As always with long-gamma diagonal strategies, LACK of directional movement in the underlying contract is the enemy. For if the underlying market simply flatlines in the three weeks ahead, we assume the long put position will expire worthless, leaving a naked short position in the Sep put that exposes unlimited risk. But such lack of movement over the course of the next week or 10 days or so would nullify the reasons for this trade and warrant its cover at a small loss long before this strategy becomes subject to such unlimited risk.
Please contact your RJO representative for an update bid/offer quote on the Jul 119-1/2 – Sep 117-1/2 Put Diagonal strategy.


