JUL CRUDE OIL
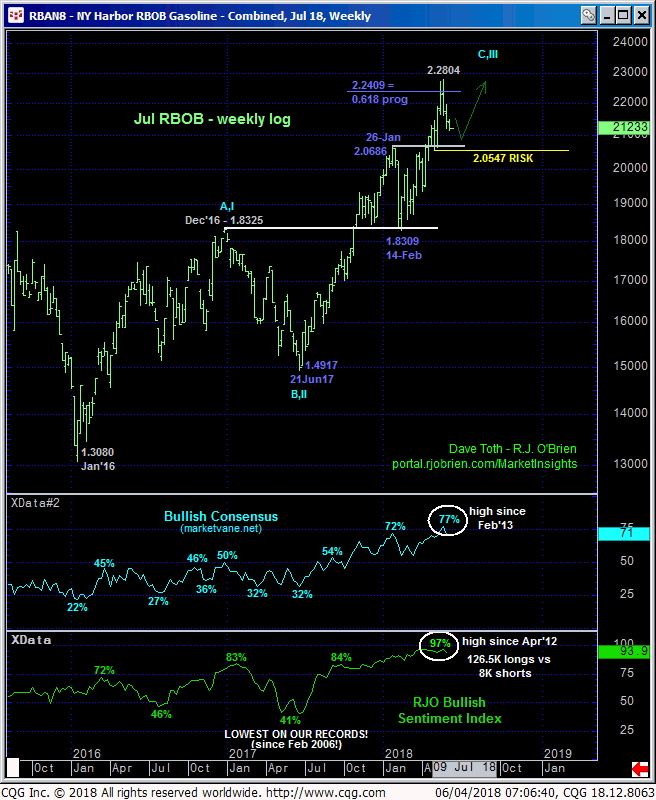
Fri and today’s break below 28-May’s 65.80 initial counter-trend low reaffirms our interim bearish count introduced in 25-May’s Technical Blog and leaves Wed’s 68.67 high in its wake as the latest smaller-degree corrective high this market is now required to recoup to stem what’s at least an intermediate-term downtrend. Per such, this 68.67 high becomes our new short-term risk parameter from which interim non-bullish decisions like long-covers and cautious bearish punts can be objectively rebased and managed.
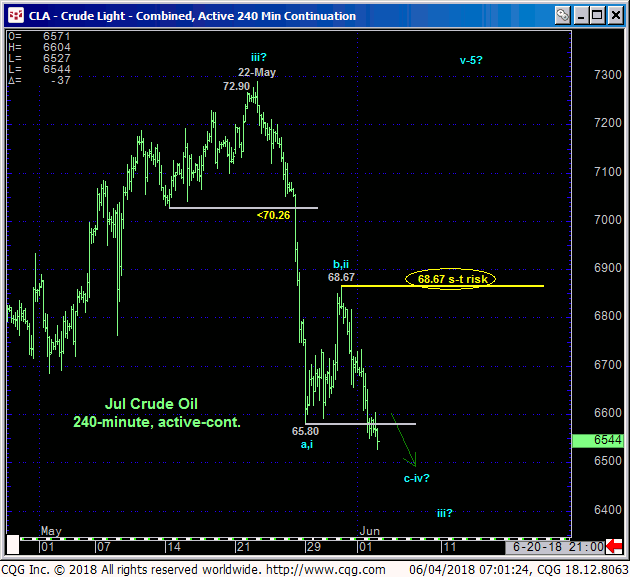
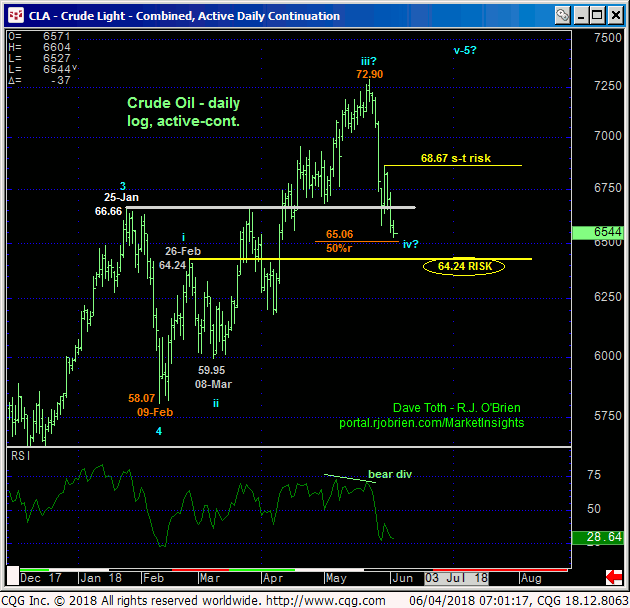
From a longer-term perspective the market’s engaging a crucially important area around the 64.25-to-66.50-range shown in the daily (above) and weekly (below) log scale charts. These levels marked 26-Feb’s initial 1st-Wave high of a wave sequence coming out of 09-Feb’s 58.07 low and key former resistance from late-Jan until 11-Apr’s breakout above it. IF the past couple weeks’ relapse is just another correction within the major 28-MONTH bull trend, we would expect this 66.50-to-64.25-range to hold as new support.
Conversely, the prospect that 22-May’s 72.90 high COMPLETED a major 5-wave Elliott sequence from Jun;17’s 42.05 low is easy to see in the weekly chart below. An “outside WEEK” (higher high, lower low and lower close than the preceding week) two weeks ago and historically frothy bullish sentiment certainly can be considered contributing elements to a peak/reversal threat that could be major in scope.
These issues considered, a neutral-to-cautiously-bearish policy remains advised for shorter-term traders with a recovery above 68.67 required to negate this call and warrant a move to a neutral/sideline position. A cautious bullish policy remains advised for long-term players with a failure below 64.24 required to negate this call and warrant a move to the sidelines ahead of what could protracted weakness thereafter.
JUL HEATING OIL
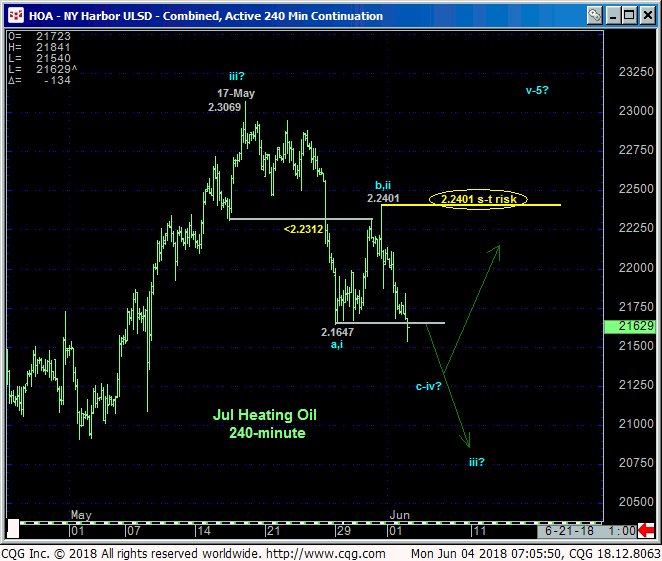
The technical construct and expectations for heating oil are virtually identical to those detailed above in crude oil following today’s break below 28-May’s 2.1647 initial counter-trend low that leaves 31-May’s 2.2401 high in its wake as the latest smaller-degree corrective high and new short-term risk parameter from which non-bullish decisions like long-covers and cautious bearish punts can be objectively rebased and managed.
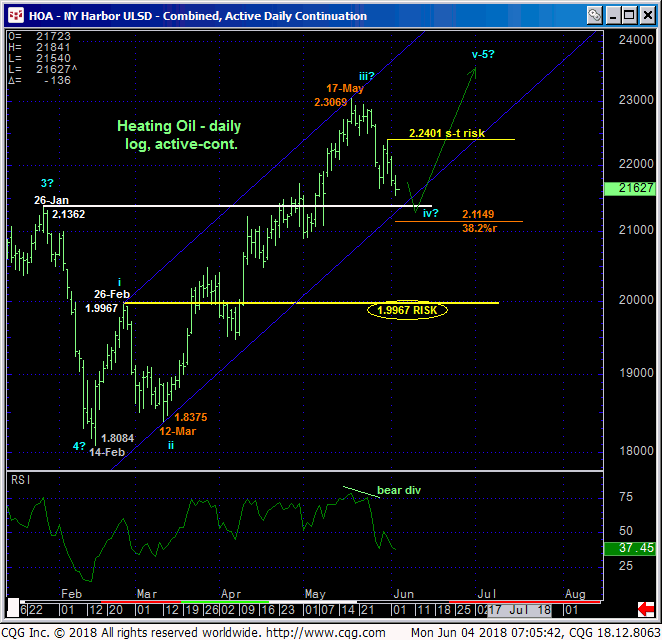
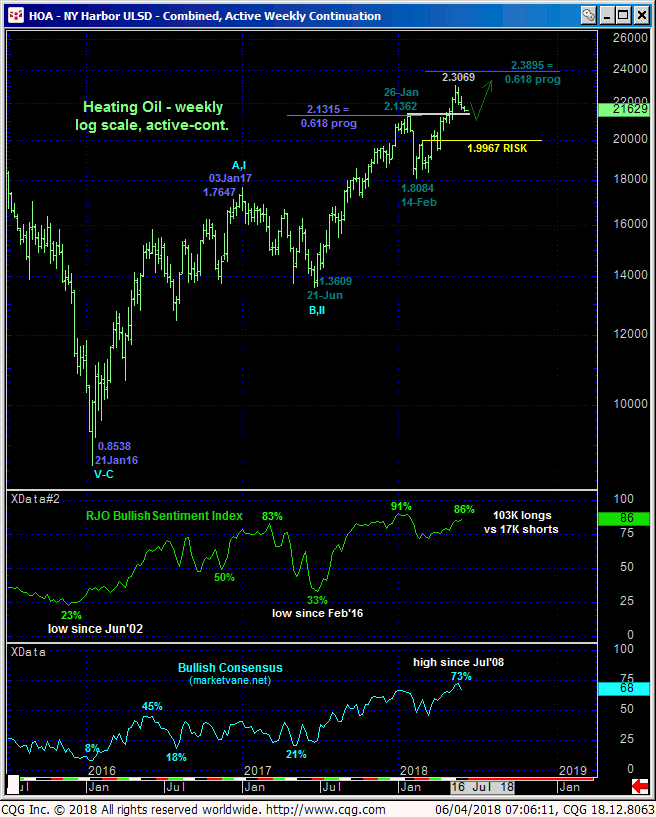
From a long-term perspective the daily (above) and weekly (below) log scale charts show the market only now approaching key from 2.13-handle-area resistance as a new key support candidate. Against the backdrop of the secular bull trend the past couple weeks’ sell-off attempt thus far falls well within the bounds of a mere correction ahead of a resumption of the secular bull. Commensurately larger-degree weakness below 26-Feb’s 1.9967 (1st-Wave) high and key long-term risk parameter remains required to negate the long-term bull and expose a major peak/reversal threat.
In sum, shorter-term traders are advised to maintain a neutral-to-cautious bearish policy with strength above 2.2401 required to negate this call, warrant its cover and resurrect the secular bull. A cautious bullish policy remains advised for long-term players with a failure below 1.9967 required to negate this call and warrant its cover. We will be watchful in the week or two ahead for a countering bullish divergence in short-term mo that we believe will swing the risk/reward merits back in favor of the bull for shorter-term traders.
JUL RBOB
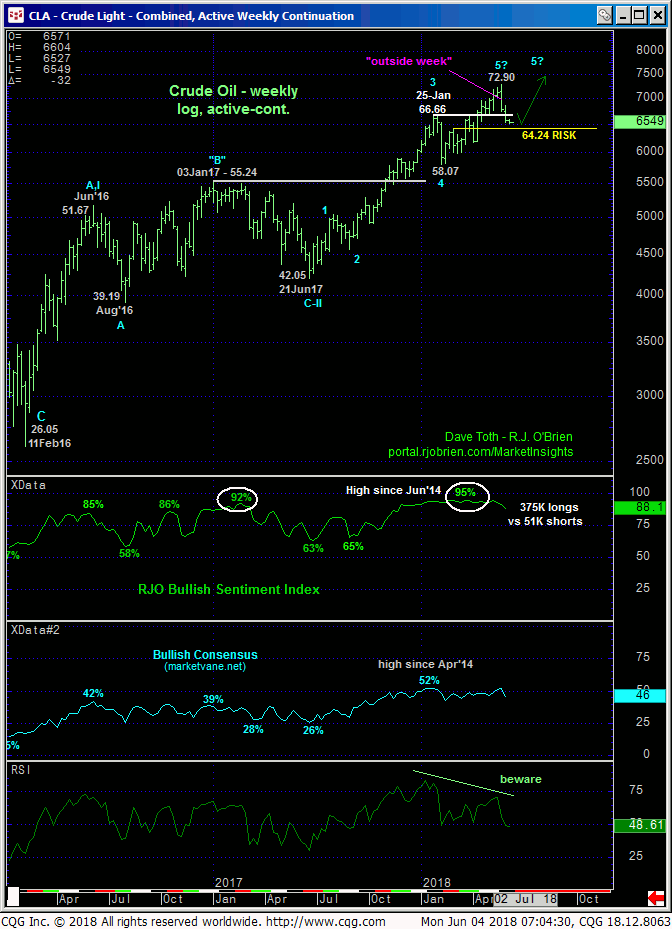
The technical construct and expectations for Jul RBOB are virtually identical to those detail above for crude and heating oil with 31-May’s smaller-degree corrective high serving as our new short-term risk parameter from which shorter-term traders can objectively rebase and manage the risk of a still-advised cautious bearish policy.
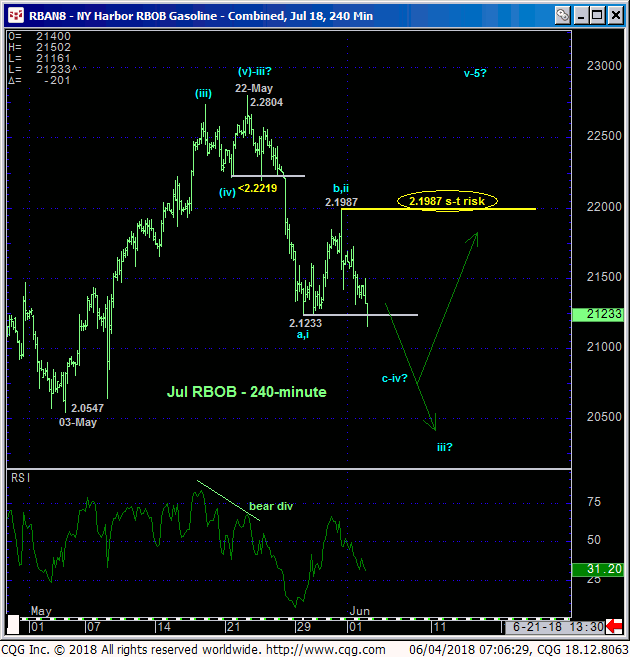
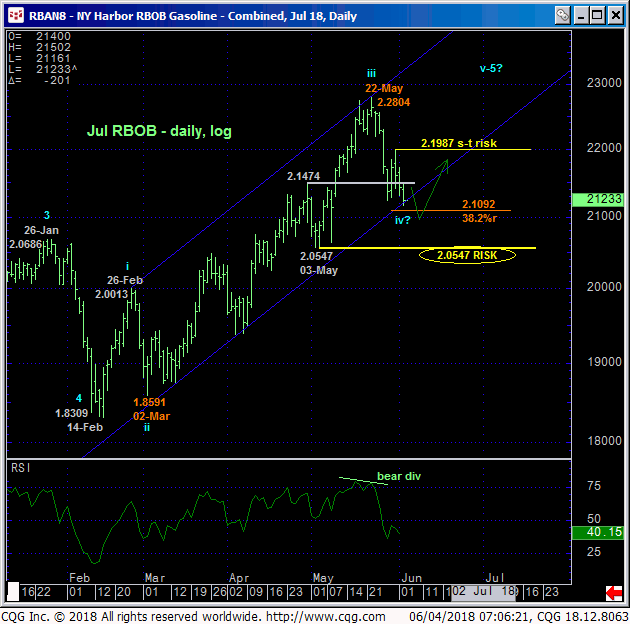
From a long-term perspective the magnitude of the secular advance precludes us from concluding anything more than another interim bull market correction with commensurately larger-degree weakness below 03-May’s 2.0547 next larger-degree corrective low and key risk parameter required to threaten the major bull enough to warrant a move to the sidelines by long-term players. In lieu of such weakness a cautious bullish policy remains advised for long-term players with former 2.06-handle-area resistance considered a new support candidate within the context of the long-term uptrend.
