We’ve been generally bullish the crude oil market since introducing a major base/reversal count in 18Feb2016’s Technical Blog and calling for a correction or reversal to the 65-to-90-area. For the reasons cited below, we believe the 28-month bull trend may be in serious jeopardy of being over.
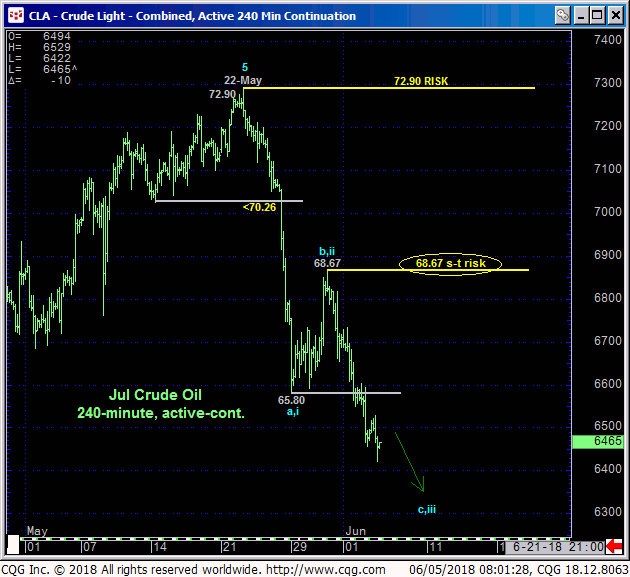
Starting from a very short-term perspective, this week’s resumed weakness below 28-May’s 65.80 initial counter-trend low reaffirms at least the intermediate-term downtrend. The important by-product of this resumed weakness is the market’s definition of 30-May’s 68.67 high as the latest smaller-degree corrective high and new short-term risk parameter this market is now minimally required to recoup to threaten a bearish prospect that began with 25-May’s short-term mo failure below 70.26 discussed in that day’s Technical Blog. Former 65.80-area support is considered new near-term resistance ahead of further and possibly surprising losses.

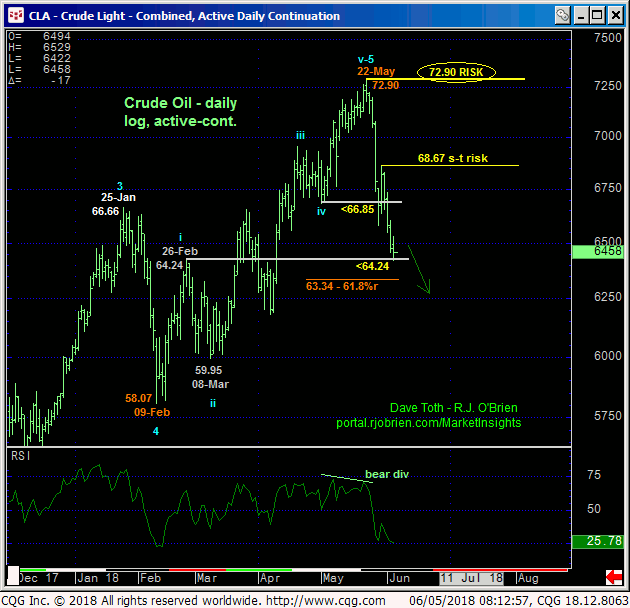
Taking a step back to consider a daily scale, if 29-May’s failure below 01-May’s 66.85 didn’t warn that 22-May’s 72.90 high completed a 5-wave Elliott sequence from 09-Feb’s 58.07 low, today’s break below 26-Feb’s 64.24 (1st-Wave) high and our very liberal longer-term bull risk parameter certainly did. As a result of this continued weakness we are marking 22-May’s 72.90 high as not only the END of a 5-wave Elliott sequence from 09-Feb’s 58.07 low and our new long-term risk parameter, but also the prospect end to the 11-month rally from Jun’17’s 42.05 low that, if correct, would expose potentially extensive losses in the months and perhaps quarters ahead.

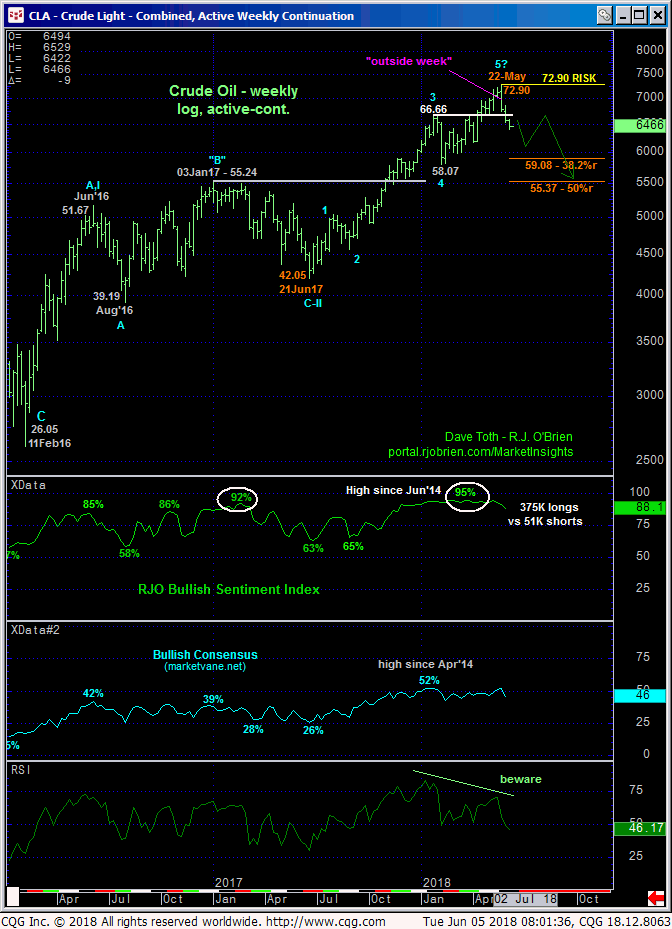
The weekly log scale active-continuation chart below shows this year’s Feb-May rally from 58.07 to 72.90 as the COMPLETING 5th-Wave to a major and even textbook Elliott sequence from 21Jun17’s 42.05 low. The “outside WEEK” the week of the high and historically frothy levels in our RJO Bullish Sentiment Index of the hot Managed Money positions reportable to the CFTC are key contributing factors to this major peak/reversal threat that, if correct, we believe exposes even a more correction to the 59-to-55-range in the MONTHS ahead.
The 59- and 55-handle references mark the 38.2% and 50% retraces of Jun’17-May’18’s 42.05 – 72.90 rally. And given that the 55-handle capped this market as major resistance from Jan’17’s high until it gave way to the bull last Nov, this 55-handle-area is a key new support candidate.

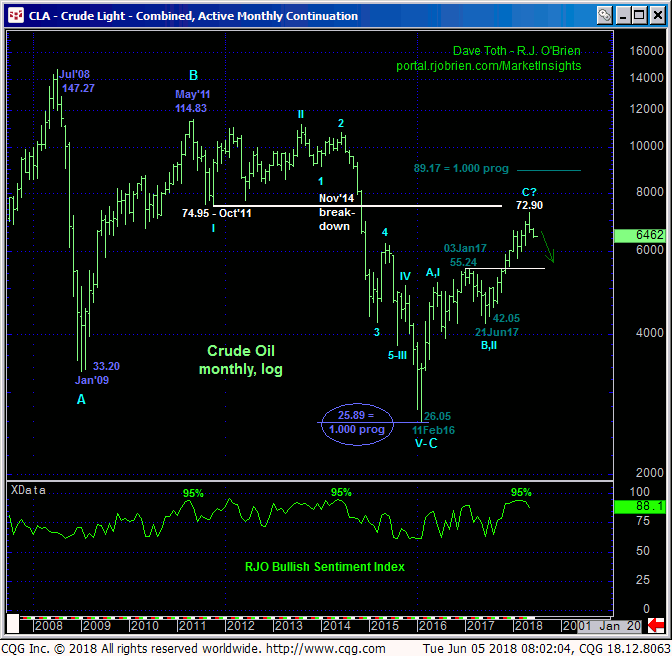
From a historic perspective shown in the monthly log chart below, we cited the 65-to-90-range as a long-term target for the 2016-17-18 bull. This range was bounded by the 61.8% retrace of 2011-2016’s 114.83 – 26.05 secular bear market and the 1.000 progression of 2016-17’s 26.05 – 55.24 rally from Jun;17’s 42.05 low. These merely derived Fib levels sandwiched a TON of former support from the 75-handle area from Oct 2011 until int Nov 2014 breakdown. It’s easy to see the prospect of this general 75-area as a major resistance candidate from this perspective. And now, as a result of the extent of the past couple weeks’ relapse and accompanying momentum failure and historically frothy sentiment, that major peak/reversal count could now stem from 22-May’s 72.90 high.
These issues considered, a bearish policy remains advised for shorter-term traders with a recovery above 68.67 required to negate this specific call and warrant its cover. Long-term players have been advised to neutralize all previously recommended bullish exposure and are further advised to move to a neutral/sideline policy, opting not to “chase” this initial counter-trend weakness lower due to what we believe are poor risk/reward merits of doing so. Rather, we advise waiting for a corrective (B- or 2nd-wave) rebuttal to this weakness typical of most major peak/reversal processes for a preferred risk/reward selling opportunity. Cautious bearish exposure from the 65.50-area OB is OK with a recovery above 68.67 required to neutralize this position. In lieu of at least such 68.67+ strength however, further and possibly accelerated losses should not surprise. This bearish call in crude is also likely to impact diesel and RBOB prices similarly.


