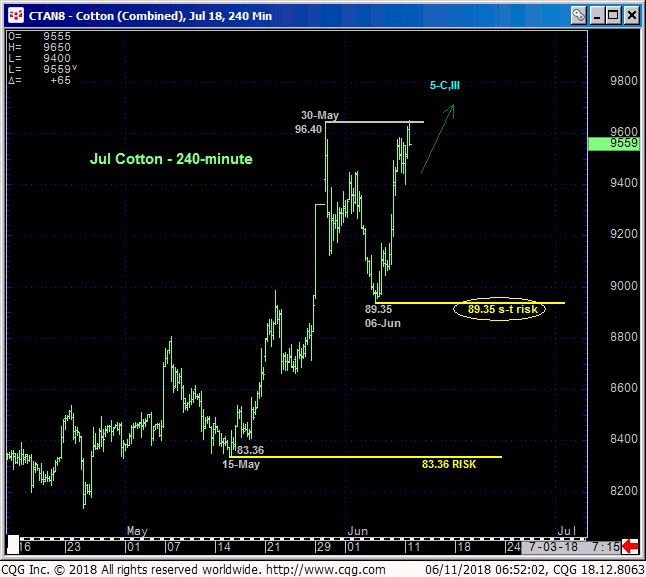
Overnight’s poke above 30-May’s 96.40 high reaffirms our broader bullish count updated most recently in 29-May’s Technical Blog and, most importantly, leaves 06-Jun’s 89.35 low in its wake as the latest smaller-degree corrective low this market is now minimally required to fail below to threaten the major bull. In this regard this 89.35 low becomes our new short-term risk parameter from which a still-advised bullish policy can be objectively rebased and managed.


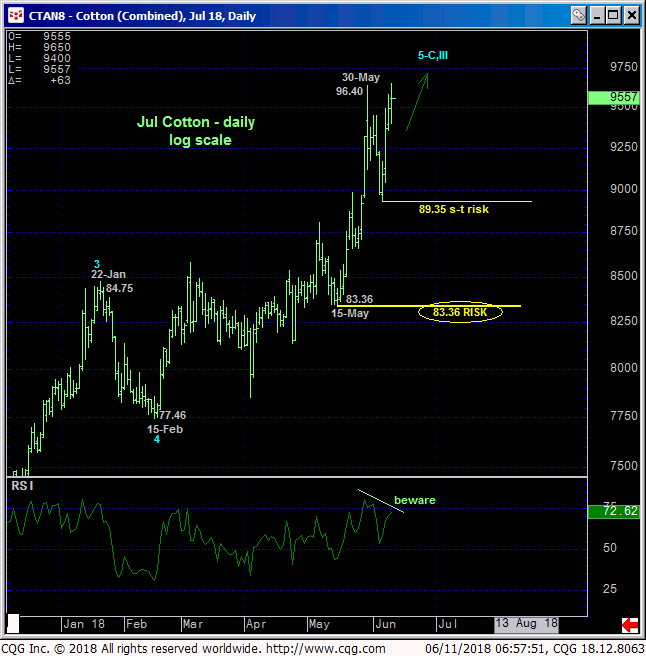
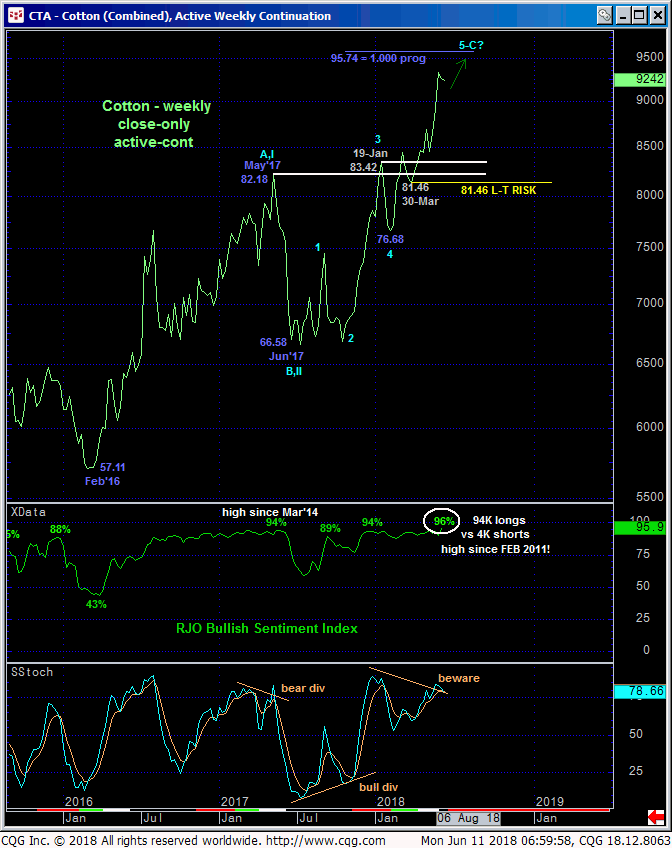
By virtue of overnight’s continuation of the past few days’ rally, the daily log chart above and weekly close-only chart below show that the trend is up on all scales. The uptrend remains as the dominant technical factor and should not surprise by its continuance or acceleration. This said however, traders should also be aware of three developing threats to the bull:
- the developing potential for a bearish divergence in daily momentum (confirmed below 89.35)
- last week’s 96% reading in our RJO Bullish Sentiment Index of the hot Managed Money positions reportable to the CFTC (highest in over SEVEN YEARS) and
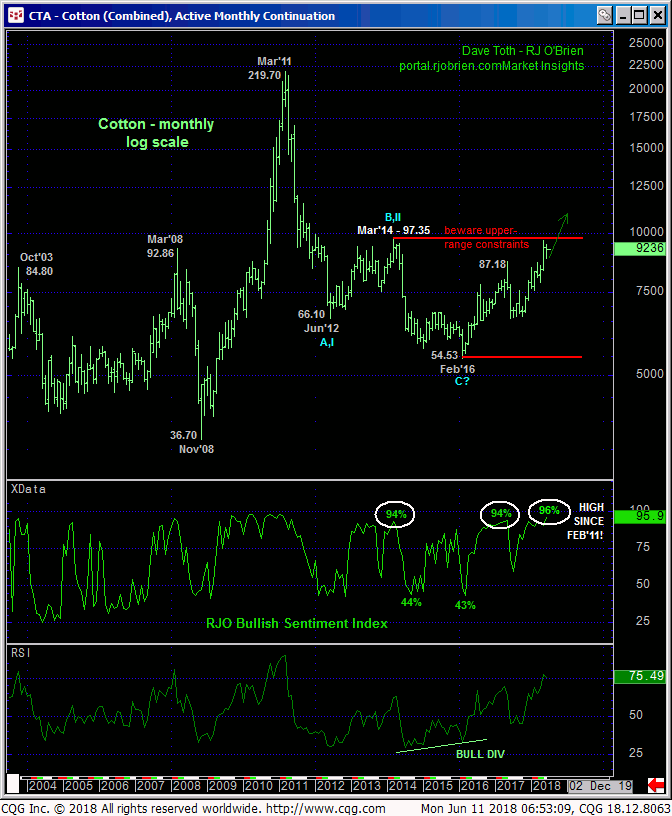
- the market’s encroachment on Mar’14’s 97.35 high and upper boundary to a lateral range that arguably dates back to Jun 2012.

The monthly log active-continuation chart below shows the market’s proximity to the extreme upper recesses of a 6-YEAR range. Amidst the threat of a bearish divergence in momentum and understandably historically frothy sentiment, if there’s a time and place for this bull to peak out it’s here and now. But herein lies the importance of last Wed’s admittedly short-term corrective low and risk parameter at 89.35. For until and unless this market proves weakness below AT LEAST this minor corrective low, the trend is up on all scales and should not surprise by its continuance or ACCELERATION. Indeed, a clear break of a 6-YEAR high could expose steep gains to indeterminately higher levels straight away.
These issues considered, a full bullish policy and exposure remain advised with a failure below 890.35 required to pare or neutralize bullish exposure commensurate with one’s personal risk profile. In lieu of such sub-89.35 weakness further and possibly accelerated gains remain expected.


