Trying to count lateral, rangey environments while they’re unfolding- regardless of the technical language or “theory” one uses to do so (i.e. Elliott, Dow, candlesticks, whatev’)- is pretty much a futile exercise. The odds of doing so successfully are low. The odds of doing so successfully and with regularity are zero. Our approach in dealing with such environments- that happen about 2/3rds of the time- is to identify and avoid the middle-half of the range and be watchful for bearish divergences in momentum from the upper-quarter of the range for a preferred risk/reward sell and, conversely, a bullish divergence in mo from the lower-quarter of the range for a favorable risk/reward punt from the bull side. Yet, we’re gonna throw cation to the wind and take a whack at trying to count what we suspect is a corrective rebound over the past week within a larger-degree correction or reversal lower.
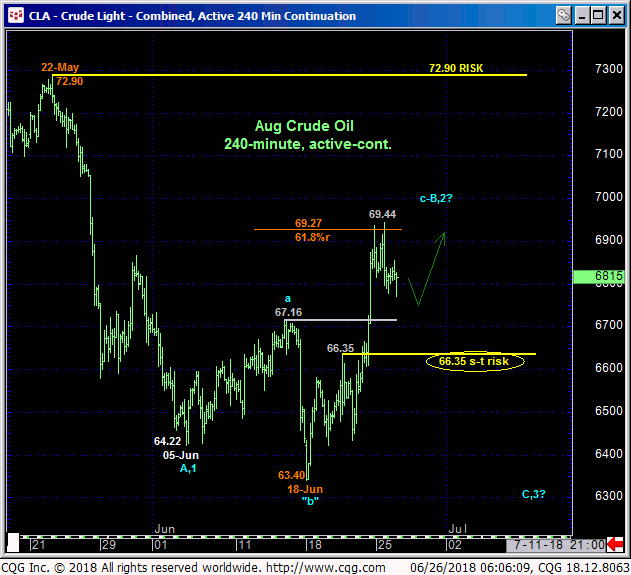
The 240-min chart below shows the continued gains following Fri’s bullish divergence in momentum above 14-Jun’s 67.17 high discussed in Fri’s Technical Blog. On the heels of larger-degree PEAK/reversal-threat factors we’ll discuss below, our suspicion is that the recovery from 05-Jun’s 64.22 low- that includes a new (“b-Wave irregular”) low to 63.40, is all part of a (B- or 2nd-Wave) correction of late-May/early-Jun’s initial decline from 72.90 to 64.22.
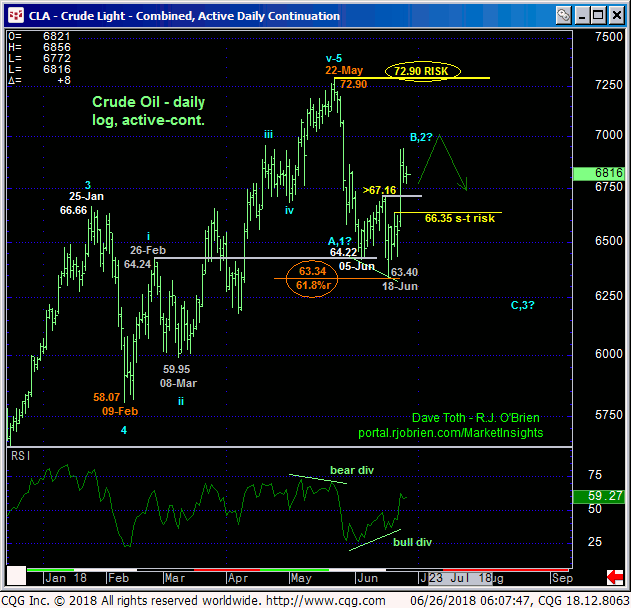
This chart also shows the market flirting with the (69.27) 61.8% retrace of May-Jun’s entire 72.90 – 63.40 decline, a Fibonacci relationship that’s not unusual in a broader peak/reversal PROCESS. However, the market has yet to break the clear and present intermediate-term uptrend, so further gains within the past month’s range should not surprise. But then again, the market is sitting smack in the middle of this range where we always approach the odds of aimless whipsaw risk as higher.
To jeopardize the trendy, impulsive integrity of the past week’s nicely-unfolding uptrend, the market is required to break an arguable minor 1st-Wave high defined by 20-Jun’s 66.35 high. Per such we are defining this 66.35 level as our new short-term bull risk parameter. In lieu of such sub-66.35 weakness OR a confirmed bearish divergence in momentum from some higher level but below 22-May’s 72.90 high, further intra-range gains should not surprise.


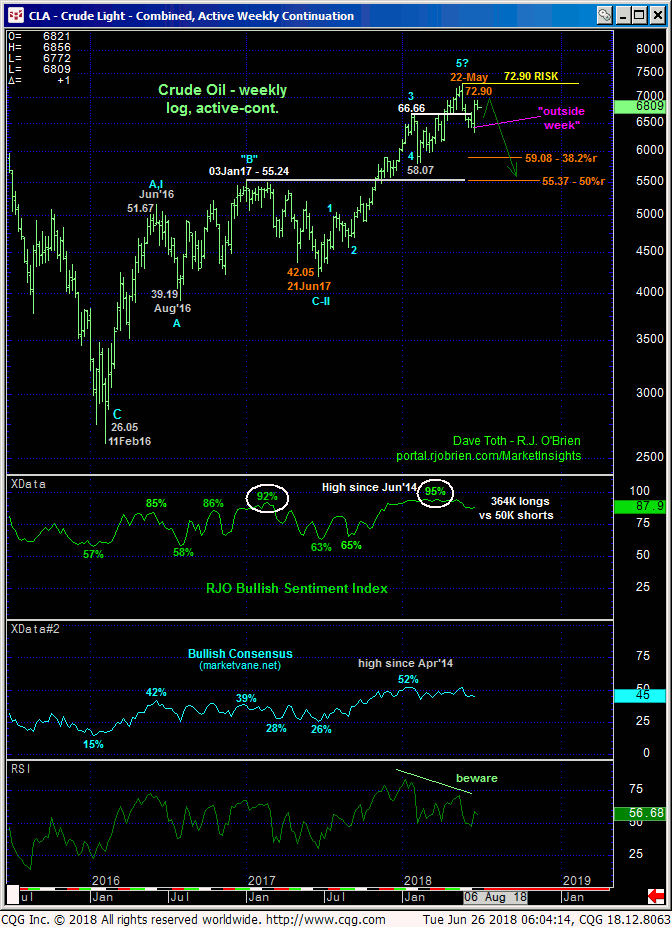
A month ago, in 25-May’s Technical Blog, we introduced the elements that threatened the long-term bull trend from Jun’17’s 42.05 low. These elements included:
- a bearish divergence in momentum of a scale sufficient to conclude the end of a rally from at least 09-Feb’s 58.07 low
- historically frothy bullish sentiment and
- an arguably complete 5-wave Elliott sequence dating from Jun’17’s 42.05 low labeled in the weekly log chart below.
Subsequent weakness reinforces this major peak/correction/reversal environment and defines 22-May’s 72.90 high as THE key high and risk parameter this market is now required to break to negate this call and reinstate the secular bull. Recovery attempts prior to 72.90 should be approached with suspicion as mere (B- or 2nd-Wave) corrections within a broader peak/correction/reversal environment. And herein lies the importance of requiring a momentum failure on an intermediate-term basis the stem the clear and present intermediate-term UPtrend and provide a specific and reliable high, resistance and risk parameter from which to objectively base and manage a bearish policy. “Selling into” the current rally may be considered by long-term players, but it assumes and accepts the commensurately larger-degree risk to 22-May’s 72.90 high.
These issues considered, a neutral-to-cautiously-bullish policy remains advised with a failure below 66.35 required to negate this call and warrant a move to a new bearish policy for both short- and longer-term traders. We will be watchful for a confirmed bearish divergence in momentum from the 69.50-area that will also provide a favorable risk/reward selling opportunity. In lieu of such an intermediate uptrend-stemming mo failure, further gains should not surprise.


