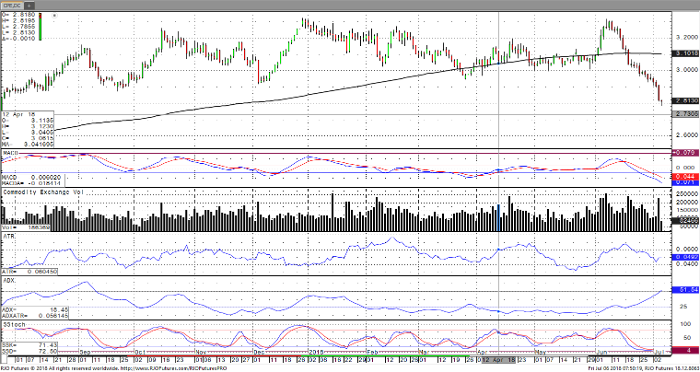
There’s no doubt that the Chinese trade war has made an impact on copper prices by leaving it the second worst performing commodity year-to-date, down over 14.50%. Rising interest rates increase the cost of warehousing and financing projects which also hurts demand. Looking at the futures curve moving farther out in time does show a short-term supply issue, but it looks to be easily resolved into next year. One would need to monitor the trade war situation to see if it continues to escalate. If we see it continue, China will most likely look to Brazil for sources of copper. However, anyway you look at it this should result in lower consumption and slower demand growth for the product.
Below is a daily chart of September Copper showing the decline from the announcement of the tariffs.
Copper Sep ’18 Daily Chart


