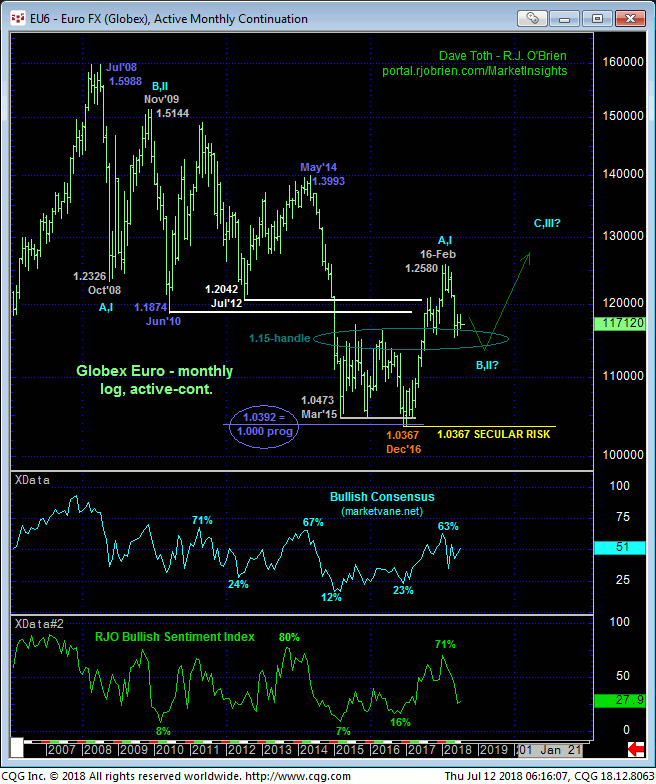
There hasn’t been much to write about since 22-Jun’s Technical Blog warned of an interim corrective rebound. Only a quick glance at the 240-min chart below is needed to see that the market has been choppin’ around in such a correction since that last update. But as a result of yesterday and overnight’s relapse below Tue’s 1.1749 initial counter-trend low on a very micro scale, the market has confirmed a bearish divergence in momentum that defines Mon’s 1.1852 high in the Sep contract as one of developing importance and very possibly the end of a 3-wave recovery from 21-Jun’s 1.1582 low. Left unaltered by a recovery above 1.1852, this 3-wave recovery attempt is considered a corrective/consolidative event that warns of a resumption of mid-Jun’s downtrend that preceded it. Per such Tue’s 1.1852 high may be considered a micro risk parameter from which a still-advised bearish policy and exposure can be objectively rebased and managed.
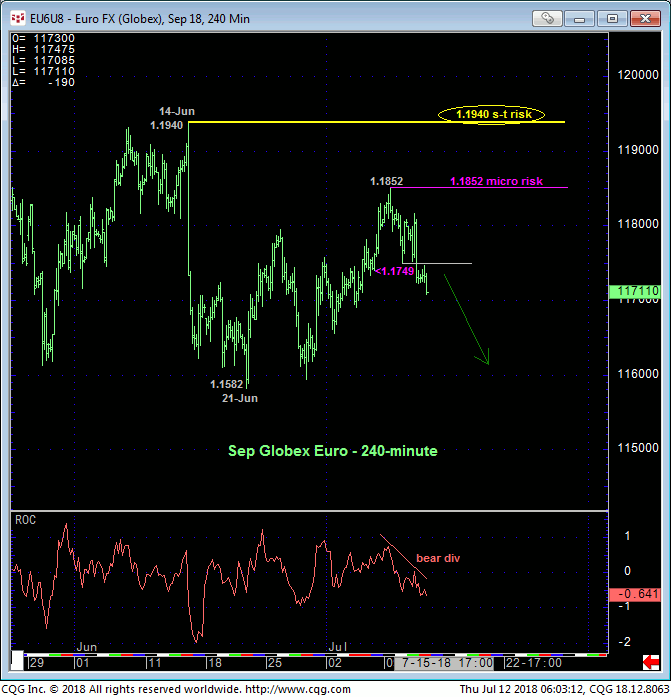
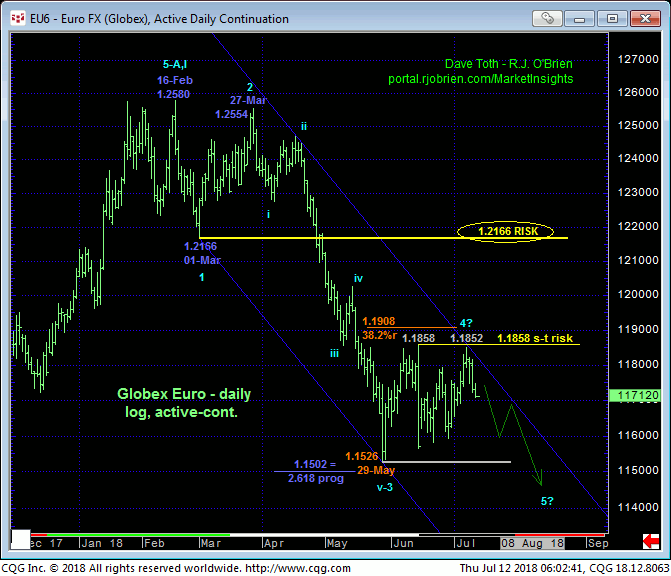
This 1.1852 high takes on added importance where, on a daily log active-continuation chart basis above, it’s just shy of 14-Jun’s 1.1858 high and upper-boundary of what we believe is (4th-Wave) correction within a trendy, impulsive decline from 25-Jan’s 1.2577 high that has at least a (5th-Wave) resumption of the decline to new lows below 29-May’s 1.1526 low still ahead to complete the wave sequence. In this regard we are still considering 14-Jun’s 1.1858 high as our short-term risk parameter this market is minimally required to recoup to threaten our broader bearish count that calls for further correction or reversal of the even broader uptrend from 15Dec16’s 1.0367 low to this year’s Jan high at 1.2577.
We’ve noted the 50% and 61.8% retracements of the 2017 rally at 1.1419 and 1.1161, respectively. But as long-time readers of our analysis know, such merely “derived” technical levels like trend lines, Bollinger bands, imokus, the ever-useless moving averages and even the vaunted Fibonacci relationships we cite often in our analysis NEVER have proven to be reliable reasons to define support (or resistance) without an accompanying momentum failure required to, in fact, break the trend in question. And they never will.
Currently and from a long-term perspective, we have noted 01-Mar’s 1.2166 1st-Wave low as our long-term risk parameter this market is required to recover above to jeopardize the impulsive integrity of this year’s major downtrend. If, as we suspect, the market breaks to new lows below 29-May’s 1.1526 low, this longer-term risk parameter will be trailed to what then would become 14-Jun’s 1.1858 larger-degree corrective high and THE level the market would then be required to recoup to confirm a bullish divergence in longer-term momentum and, in fact, break the major downtrend. In lieu of such proof of “non-weakness”, the Euro’s downside potential below 1.1526 is indeterminable and potentially severe.
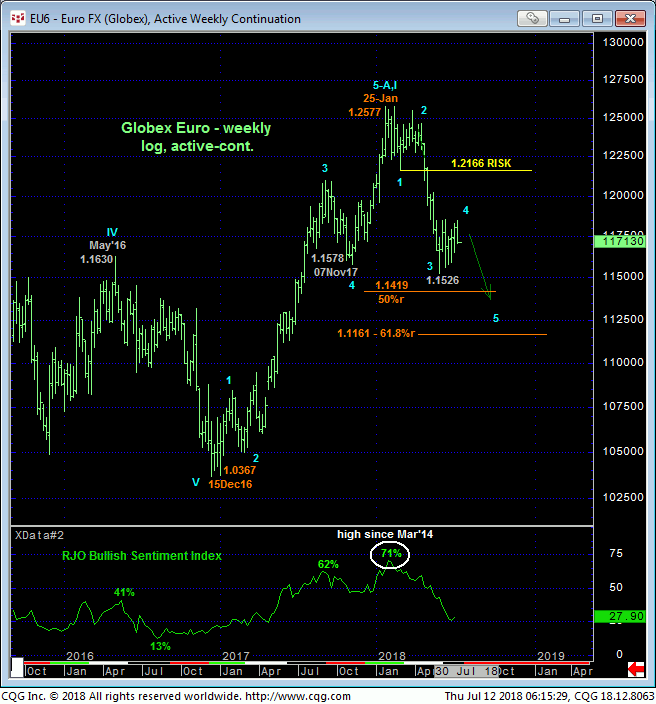
Finally, on an even longer-term monthly scale below, we’d like to remind traders that the extent and impulsiveness of 2017’s rally arguably breaks the secular bear trend in the Euro from 2008’s 1.5988 high and warns that 2018’s relapse is just the B- or 2nd-Wave in a major, multi-year BASE/reversal process that would ultimately produce levels potentially well above this year’s 1.2580 high. A break of Dec’16’s 1.0367 low is required to negate this long-term bullish call. But what lies between 29-May’s 1.1526 low and Dec’16’s 1.0367 low is anybody’s guess and should not be underestimated.
We show the general 1.15-handle-area in light blue as one that capped this market as resistance from May’15 until Jul’17’s breakout above it, leaving this area as a key prospective support candidate currently. A bullish divergence in momentum in the months ahead from this 1.15-handle area with a return to historically bearish market sentiment could produce an outstanding risk/reward buying opportunity for the long haul. But we can only cross that bridge if/when we get there.
In sum, a bearish policy and exposure remain advised with strength above 1.1858 required to threaten this call and warrant is cover. In lieu of such strength and while allowing for further intra-1.1858 – 1.1526-range chop, we anticipate an eventual resumption of this year’s bear to new lows below 1.1526 that could extend extensively thereafter.
