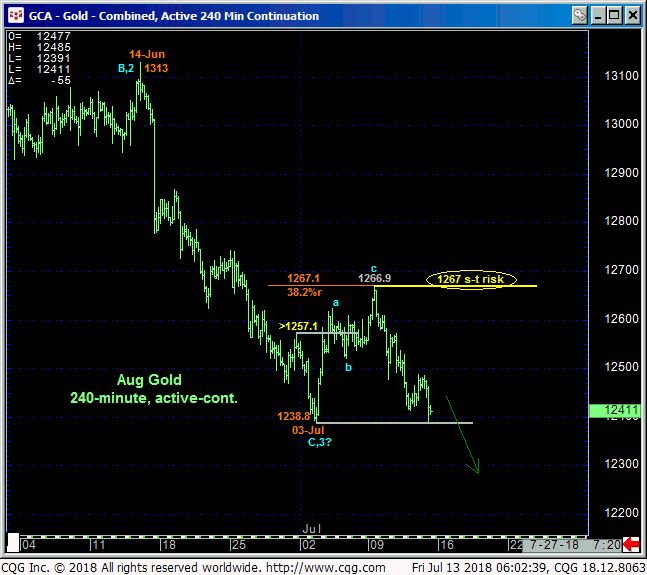
While the market has yet to break 03-Jul’s 1238.8 low, the extent of the past couple days’ relapse renders the early-Jul recovery attempt from that 1238.8 low to 09-Jul’s 1266.9 high a 3-wave affair as labeled in the 240-min chart below. Left unaltered by a recovery above 1267.0, this 3-wave pop is considered another corrective/consolidative event within the past quarter’s the still-developing bear trend that could have huge, if intra-range losses directly ahead. The Fibonacci fact that the early-Jul recovery attempt was within a mere 0.20-cents of the (1267.1) 38.2% retrace of Jun-Jul’s 1313 – 1238.8 decline reinforces this bear market correction count.
In this regard, any non-bearish action like short-covers referenced in 03-Jul’s Technical Blog should be considered null and void and shorter-term traders with tighter risk profiles would be further advised to reset any bearish exposure on the immediate failure below 1238.8 with a recovery above 1267.0 and our new short-term risk parameter required to negate this resumed bearish call.


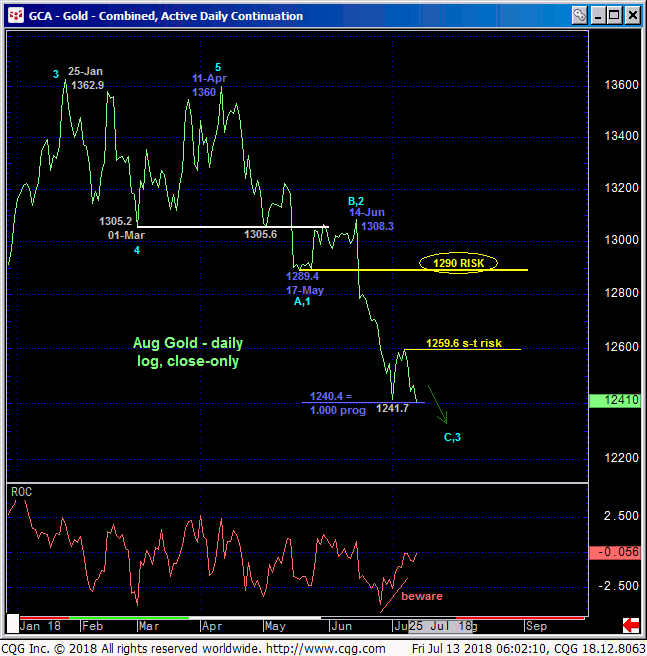
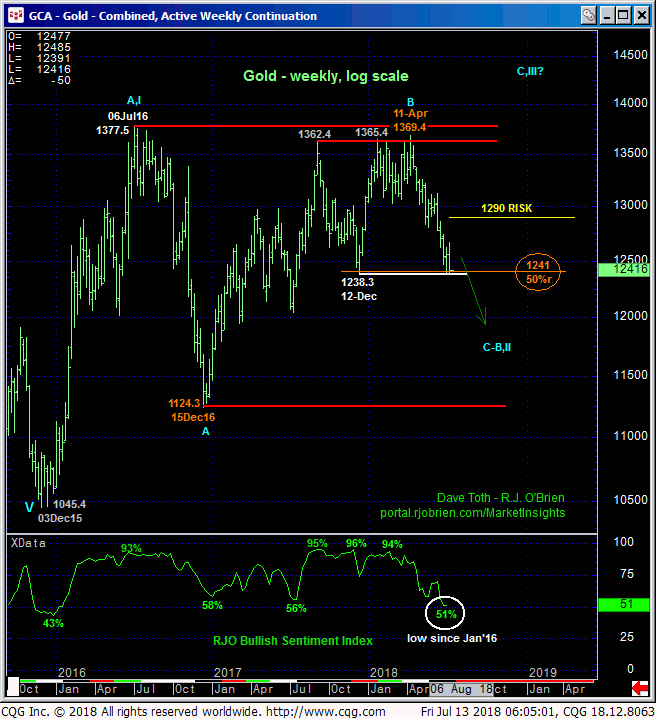
While the magnitude of the downtrend is easy to see in the daily log close-only chart above, the key issue currently is the importance of the 1238-area on a much broader weekly log scale basis below. This area marks last Dec’s major low and also the 50% retrace of the entire Dec’16 – Apr’18 rally from 1124 to 1369. A break below 1238 exposes an area totally devoid of any technical levels of merit shy of that Dec’16 low. This doesn’t mean we’re forecasting a move to 1124, but it certainly does mean that this market’s downside potential is indeterminable and potentially severe until and unless the market stems the slide with a confirmed bullish divergence in momentum. And this, quite simply, requires a recovery above a prior corrective high like 1267.
These issues considered, a full and aggressive bearish policy is advised for both short- and long-term traders with strength above 1267 minimally required to even defer, let alone threaten this call. In lieu of such 1267+ strength further and possibly extreme, even relentless losses are expected. Oh, and this count probably also means that any recent inflationary fears should at least be deferred. This bearish call would also be supportive of our bearish count in the Euro, CAD, yen and probably sterling.


