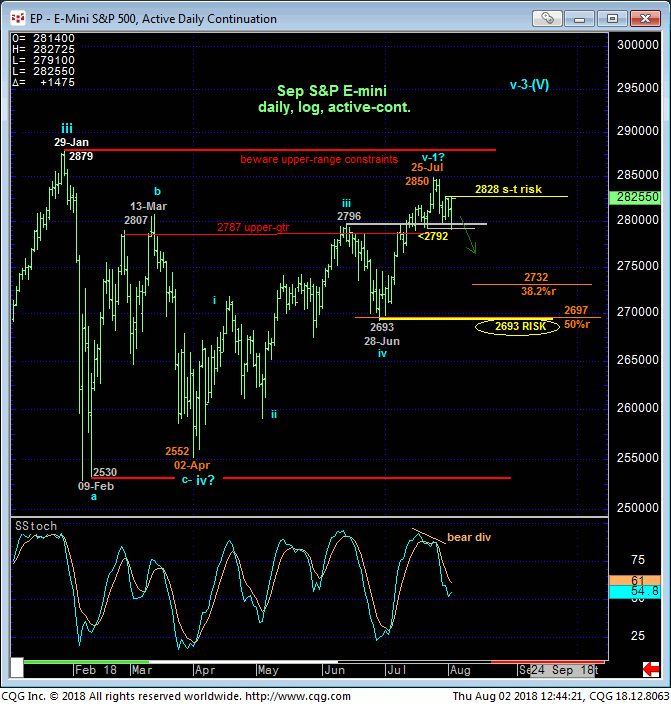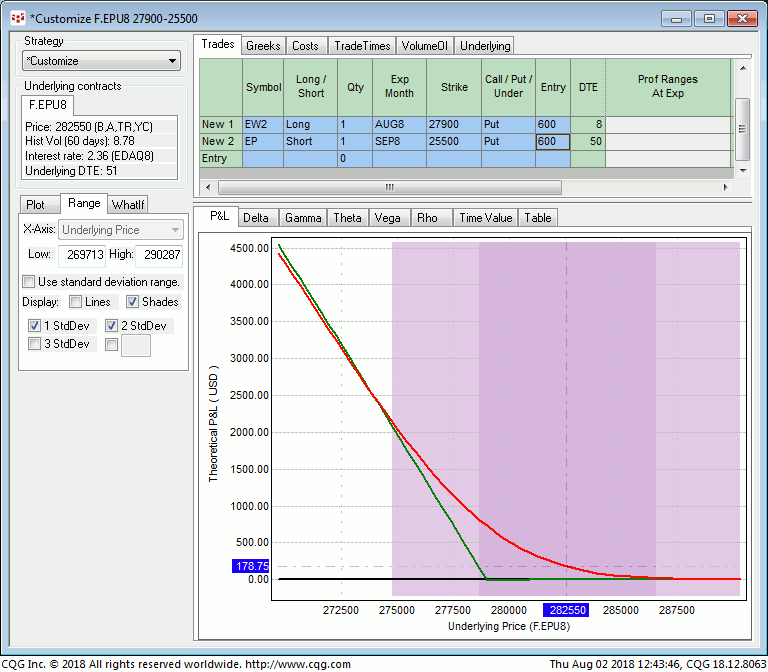
While the market pretty much rebounded shortly after the bearish divergence in momentum we discussed in this morning’s Technical Blog and is pressing our short-term risk parameter defined by Tue’s 2828 smaller-degree corrective high, last week’s 2850 high and the extreme upper recesses of this YEAR’S range remain intact just above the market that maintains the odds of what could be a more extensive corrective setback within this range. For traders who’d still like to bet on an interim peak/correction count heading into tomorrow’s key nonfarm payroll report and still get a good night’s sleep, the put diagonal strategy below may be considered.

The Aug Week-2 2790 / Sep 2550 Put Diagonal spread involves buying 1-unit of the Aug Week-2 2790 Puts for around 6.00 points and selling 1-unit of the Sep 2550 Puts for around the same amount for a net cost of “even”. This strategy provides:
- a current net delta of -0.17
- favorable gamma ratio
- negligible risk if the secular bull resumes and
- extraordinary profit potential on a sustained break below 2790, an area the market tested only earlier today.
As with all long-gamma strategies however, this advantage comes in exchange for time decay risk, or theta. As the Aug Week-2 puts will only have a week to expiration following tomorrow’s report, the bear will have to get about its business of breaking hard within that time. Mere lateral chop, let alone continuation of the past four months’ component of the secular bull will see these puts erode to zero pretty quickly while the way out-of-the-money Sep 2550 puts that have 50 days to expiration will retain much of its current value. Per such, owners of this strategy would need to see the market falling off pretty quickly to levels below 2790 by mid-next-week to maintain the position ahead of potentially sharper losses in the contract and nifty and nearly risk-free profits in the spread. If the market merely flatlines into next Tue/Wed, this strategy should be covered for what should be a small loss of no more than 6.00-pts.


