DEC CORN
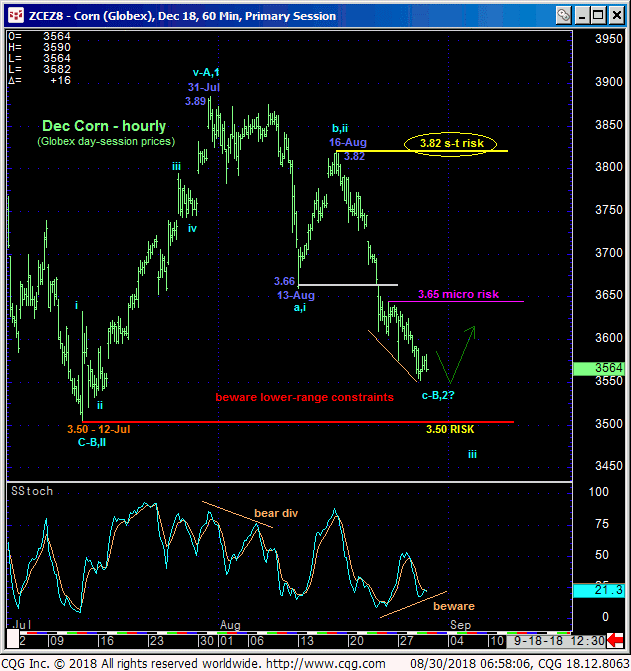
While the intermediate-term trend clearly remains down, the hourly chart below shows 1) waning downside momentum as the market engages 2) the extreme lower recesses of the past month-and-a-half’s range. If there’s a time and place to be leery of further losses, it is here and now, making for a very slippery slope for bear’s “down here”. By the same token and until the market does something to stem the intermediate-term slide, there’s no way to know that the broader bear trend from 24-May’s 4.30 high isn’t poised to resume to depths unknown below 12-Jul’s key 3.50 low and long-term bull risk parameter. This debate begs the question: What does the market minimally have to do to stem the intermediate-term downtrend and reject/define a more reliable low from which non-bearish decisions like short-covers and new bullish punts can be objectively based and managed?
In 23-Aug’s Technical Blog following that day’s break below 13-Aug’s 3.66 low, we identified 16-Aug’s 3.82 high as the latest smaller-degree corrective high this market needs to recoup to render the broader relapse attempt from 31-Jul’s 3.89 high a 3-wave and thus corrective affair we believe it to be within a much broader base/reversal count. This fact/requirement remains. From an even shorter-term perspective however and as a result of this week’s resumed but slower-rate slippage, we can point out last Fri’s 3.65 high as another smaller-degree corrective high that we can use as a micro risk parameter this market is required to sustain losses below to maintain an alternate bearish count to eventual new lows below 3.50.
A recovery above 3.65 will NOT be sufficient to conclude the end of the past MONTH’S decline from 3.89, of course. Only a recovery above 3.82 will allow us to confirm that. But such admittedly micro strength above 3.65 WILL allow us to identify a more reliable low (3.55 currently) from which any non-bearish decisions can then be objectively based and managed.
Might such micro strength above 3.65 be the next step within a major base/reversal process to eventual 3.90+ levels? For longer-term reasons we’ll discuss below, we would answer this question with another question: Do you want to bet such 3.65+ strength ISN’T the next step in such a bottoming process that presents what would be an outstanding risk/reward buying opportunity?
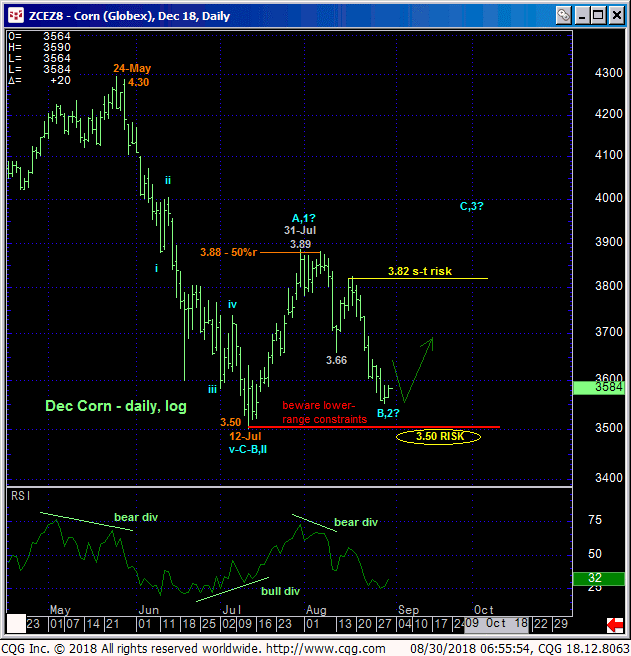
The daily log chart above shows the market’s proximity to the extreme lower recesses of the past couple months’ range where any bearish exposure is urged to be kept on a very short, conservative leash (i.e. neutralized above 3.65). And we would remind traders that as a result of a trendy, impulsive Jul rally that broke May-Jul’s downtrend, 12-Jul’s 3.50 low remains intact as THE KEY risk parameter this market still needs to break to negate a broader base/reversal process, reinstate May-Jul’s downtrend and expose potentially sharp losses thereafter.
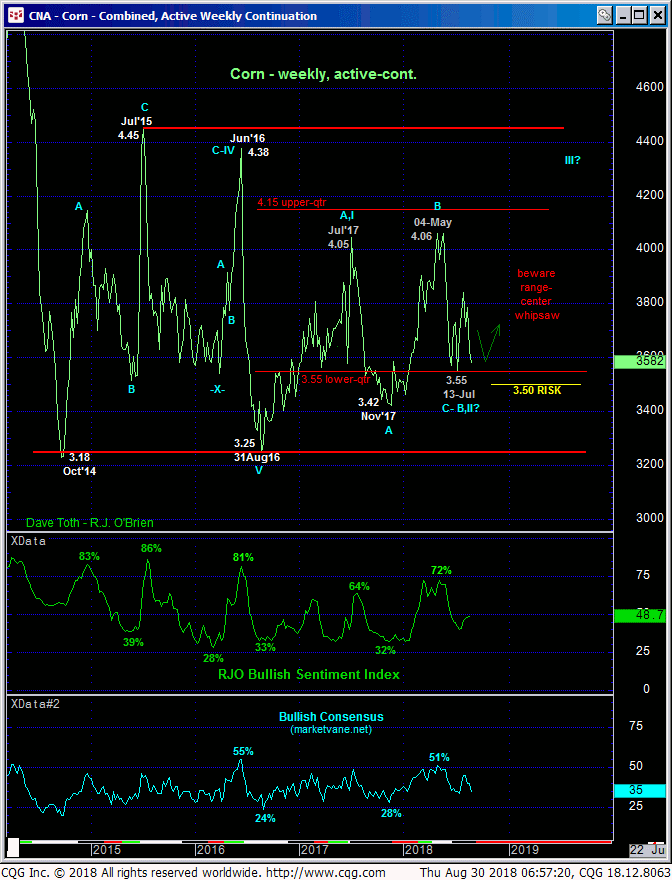
Pertinent to this longer-term base/reversal count is the market’s proximity once again to the (3.55-area) lower-quarter of the 4-YEAR range that the market has rejected numerous times over this span. For long-term players like commercial end-users, we believe current levels are favorable risk/reward gifts to be bought, the only challenge being the identification of the exact amount of risk you want to assume, how close-to-the-vest you want to play the “trade” and when/where to increase the aggressiveness of a bullish policy and exposure.
These issues considered, a cautious bullish policy remains advised for long-term players with a failure below 3.50 required to defer or threaten this call enough to warrant its cover. Shorter-term traders with tighter risk profiles are advised to either take a pure risk/reward punt from the bull side at-the-market (3.58) or better with a protective sell-stop just below 3.50 and/or wait for proof of micro strength above 3.65 before buying a subsequent dip and using yesterday’s 3.55 low as the new micro risk parameter.
NOV SOYBEANS
Generally speaking, the technical construct and expectations for the Nov bean market are identical to those detailed above for Dec corn with Mon’s 8.54 minor corrective high considered our new micro risk parameter this market is minimally required to recoup to confirm a bullish divergence in very short-term momentum needed to stem the slide and reject/define some semblance of a low and support from which non-bearish decisions can be considered objective. This 8.54 threshold is an area of former support from mid-Aug that, since broken this week, is a new near-term resistance candidate we’d expect to hold if the market has something broader to the bear side in store, like a break below 13-Jul’s key 8.26 low and long-term risk parameter.
20-Aug’s 9.05 corrective high remains intact as a key risk parameter this market is required to recoup to render the past month’s sell-off attempt from 31-Jul’s 9.22 high a 3-wave and thus corrective affair consistent with a broader base/reversal count.
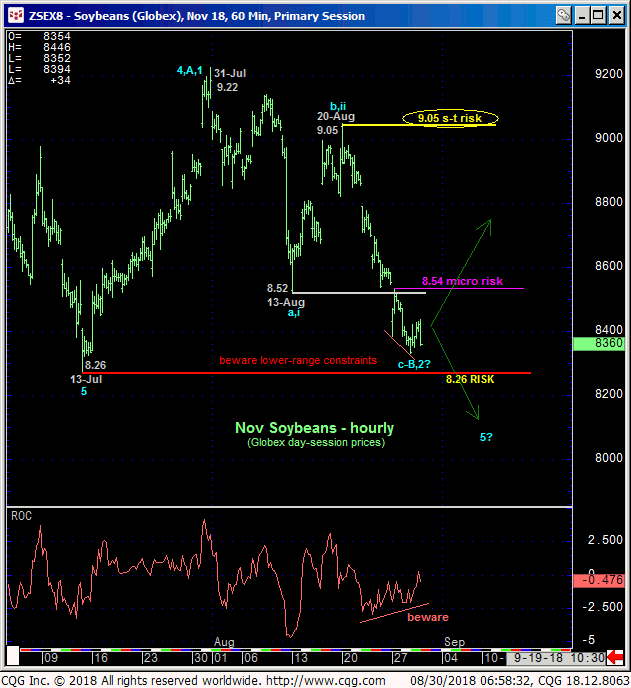
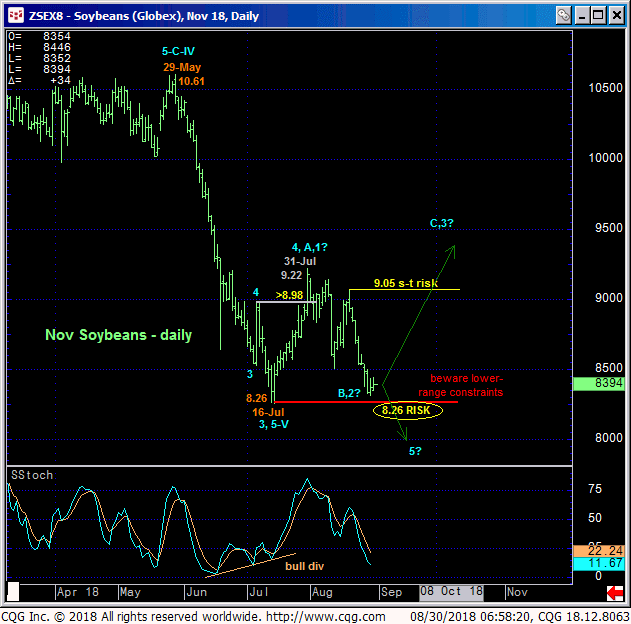
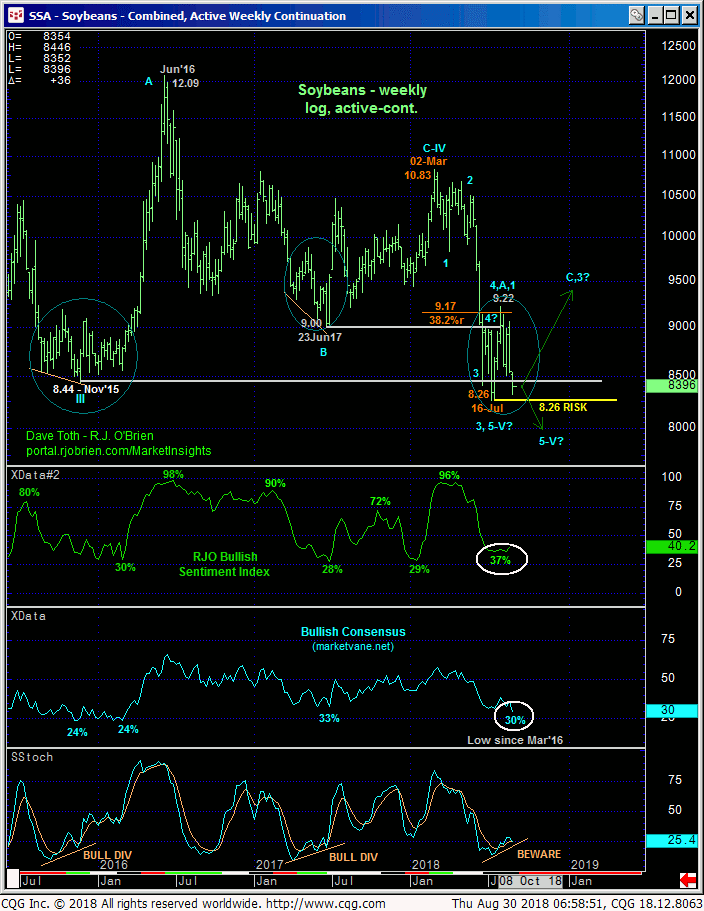
Generally speaking, the challenge remains one of discerning the price action from 13-Jul’s 8.26 low as either corrective/consolidative ahead of a resumption of May-Jul’s downtrend that preceded it OR that of a broader BASE/reversal process similar to that that surrounded Jun;17’s 9.00 low and Nov’15’s 8.44 low circled in blue in the weekly log chart below. A break below 8.26 and our key risk parameter will obviously confirm the former, bearish count. Until that 8.256 low is broken however, the past month’s severe retest of that 8.26 low may be exactly like mid-Dec’15-to-early-Jan’16’s severe retest of Nov’15’s 8.44 low that proved to be an extraordinary BUY.
Alternatively, this market could break the 8.26 low by just a few cents like the Nov’15 “resumed secular bear” did before failing to sustain those new lows indicated a base/reversal environment.
This debate/dilemma, while arguably confusing and challenging, boils down to MOMENTUM, or the bear’s ability to sustain down-trending behavior. It’s failure to do so “down here”, even on a micro scale, could leave this market vulnerable to surprising gains given the return to historically bearish sentiment levels shown in the weekly chart below. Indeed, at a new 2-1/2-year low level of 30% in the Bullish Consensus (marketvane.net), it’s not hard to find fuel for upside vulnerability.
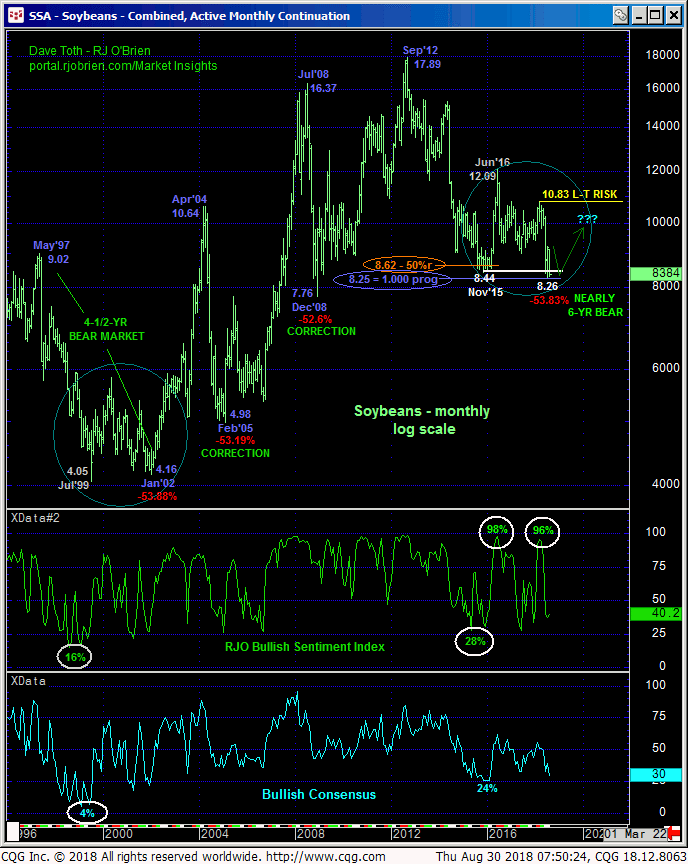
Finally and as discussed many, many times already, the monthly log scale chart below shows the secular bear trend from Sep’12’s 17.89 all-time high spanning an IDENTICAL length (i.e. 1.000 progression) to not only 1997 – 2002’s prior bear market, but also to within about 20-cents of both the 2008 and 2004 – 2005 declines. Also, the price action from Nov’15’s 8.44 low is very similar to that that followed Jan’99’s 4.05 low before presenting the buying opportunity of the next 10 years.
In sum, and almost whether or not the market breaks below 8.26, we believe current historically depressed prices and bearish sentiment present bargain-basement buying opportunities, especially for longer-term commercial traders. This said, MOMENTUM is key to stopping the slide and defining a specific and objective risk/reward buying condition. Currently, the extent and impulsiveness of Jul’s 8.26 – 9.22 rally, in fact, broke May-Jul’s downtrend, leaving 16-Jul’s 8.26 low in its wake as THE key risk parameter this market still needs to break to negate this specific count and warrant covering still-advised bullish exposure. For shorter-term traders with tighter risk profiles, a neutral/sideline policy remains advised with a recovery above 8.54 required to initiate bullish exposure with a protective sell-stop just below whatever low (8.33 currently) that micro mo failure leaves in its wake. Cautious bearish exposure, even “down here” is OK, but a recovery above 8.54 should warrant its immediate cover.
DEC WHEAT
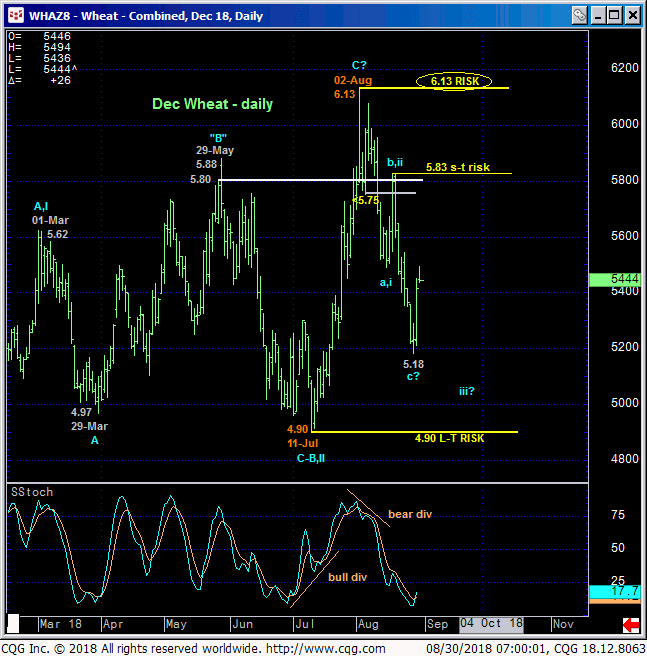
While the extent of Jul-Aug’s resumption of what is now a 2-YEAR rally in wheat separates this market from corn and beans from a long-term basis, this month’s relapse poses a similar navigational challenge as the intermediate-term trend is clearly down within a still-arguable secular bull. And in the hourly chart below we believe 22-Aug’s 5.53 smaller-degree corrective high and area of former (5.49) support-turned-resistance identifies a level and condition we believe the bear must now sustain losses below to maintain a more immediate bearish count. It’s failure to do so won’t allow us to conclude the end of this month’s broader slide from 6.13, but it WOULD reject/define a low from which non-bearish decisions like short-covers and resumed bullish punts could be objectively based and managed. Per such, 5.53 is considered our new micro risk parameter above which traders are advised to neutralize any bearish exposure and return to a bullish policy of buying dips.
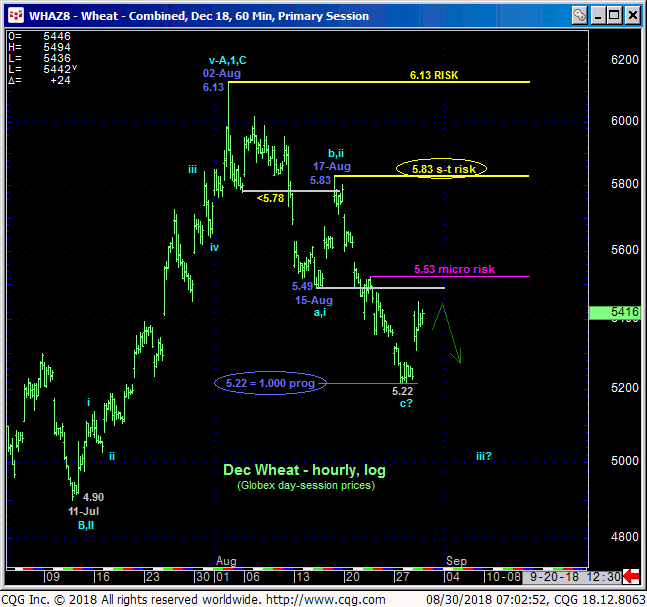
Against the backdrop of a still-arguable long-term bull, it’s very interesting to note in the hourly chart above that the past couple week’s resumed slide from 17-Aug’s 5.83 high has spanned an identical length (i.e. 1.000 progression) to 02-to-15-Aug’s preceding slide from 6.13 to 5.49 basis Globex day-session prices. Along with what is thus far only a 3-wave decline from 6.13, traders are urged not to ignore this month’s relapse attempt as a (textbook) correction within the long-term uptrend. This said however, and knowing our disdain for RELYING on merely “derived” technical levels like Fibonacci relationships, we MUST require a confirmed bullish divergence in mo above a level like 5.53 to stem the clear and present intermediate-term downtrend, expose a bigger correction or reversal higher and, most importantly, reject/define a more reliable level from which bullish decisions can only then be considered objective.
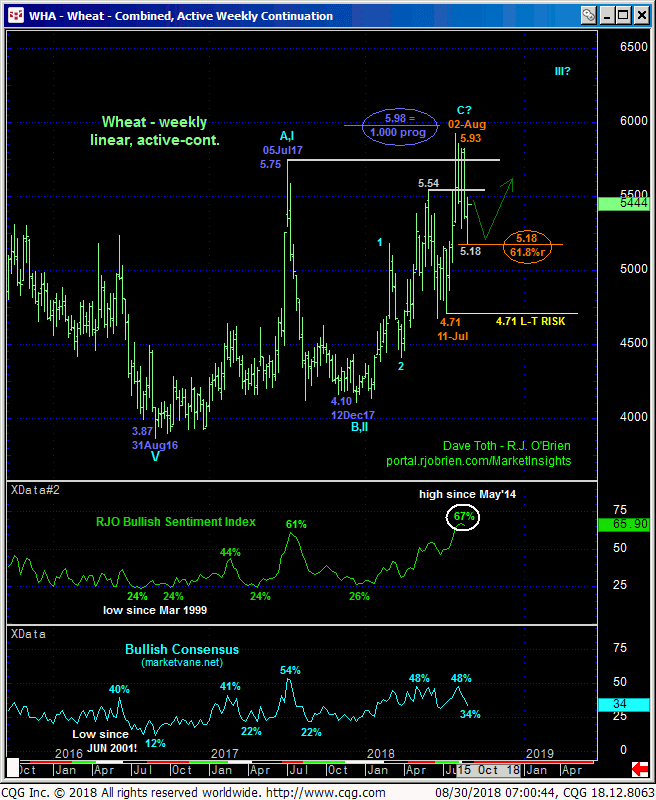
If that 1.000 Fib progression isn’t enough derived fodder, the weekly active-continuation chart below shows Tue’s overnight low of 5.18 being the EXACT 61.8% retracement of Jul-Aug’s 4.71 – 5.93-portion of the 2-YEAR bull. On this very long-term scale a relapse below that 4.71 low remains minimally required to break the secular uptrend. Basis the Dec contract that 11-Jul low and key risk parameter is 4.90.
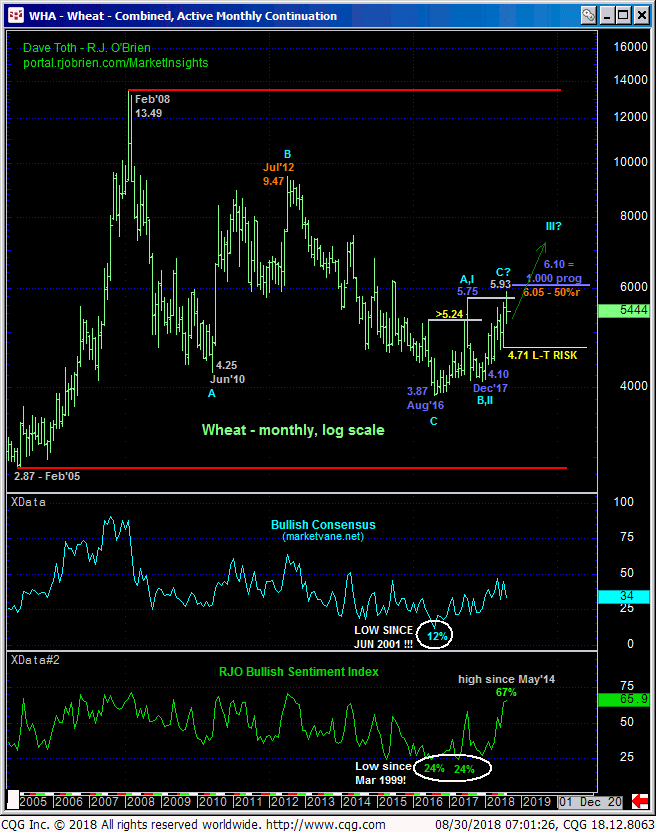
Finally, the monthly log scale chart below shows this month’s resumption/affirmation of our long-term base/reversal count above Jul’17’s 5.75 initial counter-trend high that broke the secular bear market and warned of the broader base/reversal to follow. Interestingly, this bull has thus far stalled around a pair of Fibonacci retracement and progression relationships at neighboring 6.05 and 6.10 levels. And the entire two year recovery from Aug’16’ 3.87 low is, thus far, only a 3-wave affair that cannot be ruled out as a major CORRECTION ahead of a resumption of a secular bear trend to new lows below 3.87. But until and unless this market fails below at least 4.71, there’s no way to know the rally from Dec’17’s 4.10 low isn’t the dramatic 3rd-Wave of a reversal that would be huge in scope and likely mean $8.00+ levels in the years ahead.
In sum, a cautious bearish policy and exposure from 5.78 OB remains advised with a recovery above 5.53 required to threaten this call enough to warrant its cover and shift to a buy-dips policy. In lieu of such 5.53+ strength, further lateral-to-lower prices remain expected.
