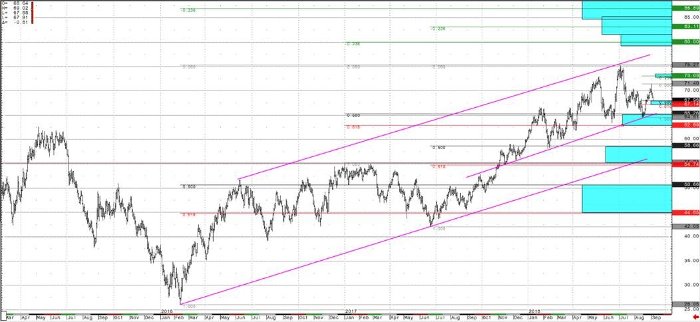
This week the EIA Petroleum Status Report decreased by a sizable -4.3-million-barrel drawdown, settling inventories for WTI crude to 401.5 million barrels (13.2% below their levels one year ago). Although a rally in price is usually expected with continued drawdowns in supplies of any commodity, I see this most recent pullback as an opportunity for WTI bulls. It’s very likely that the drawdown in WTI crude inventories is being overshadowed by the 2% drop in gasoline refinery capacity (compared to two weeks ago), which is translated to a continuation slowdown in refinery demand. If refineries slow down production, they aren’t going to replenish their stockpiles of WTI crude, and the supply chain will crunch (as can price).
From a technical perspective, WTI crude futures continue a period of price discover within a range, which is being sustained from the supportive $65.25 area inflection zone and the $71.00 price area as resistance. Upside Fibonacci price projections suggest the market could target the $80.00 price area, and technically remains bullish above the $62.89 “line in the sand” for the $65.26 inflection zone. This scenario seems to be the path of least resistance, and the next logical progression would be to for a market to trade to its technical projected targets (after finding support). While the market remains above $62.89 (61.8% Fibonacci technical ‘line in the sand’), this price level projects upside technical targets of $80.00 in the near term. Below $62.89 at this time, would suggest a retest of last support at $55.00-50.00 inflection zones, and below those levels the continuation of the current multi-week and multi-month uptrend may come into questions. In the near term, WTI crude futures have seen a multi-day price decline, right into the 61.8% Fibonacci inflection zone at $67.14. Upside from that area suggest a near term price target at the -23.6% Fibonacci price level of $73.03.
In my opinion, the rally that has taken WTI crude prices above the $66.66 continuous contract highs (into the end of 2017 and start of 2018) is still a very important “break out higher” indicator for the market’s longer term cycle. Price action over the last several months has continued to hold the market above this key line in the sand (as well as other shorter term bullish confirmation lines), and justifies keeping sights on higher prices in the near term. The fight over trend seems to be all but won by the bulls, which has continued to take the market price higher since June of 2017. Keep a watchful eye and heightened ear for more comments to come out of the US Fed – Jackson Hole meetings, as a clearer picture for US monetary / interest rate policy could help shed a light on the inflation situation (and directly affect the price of commodities relative to USD.
Crude Oil Daily Chart


