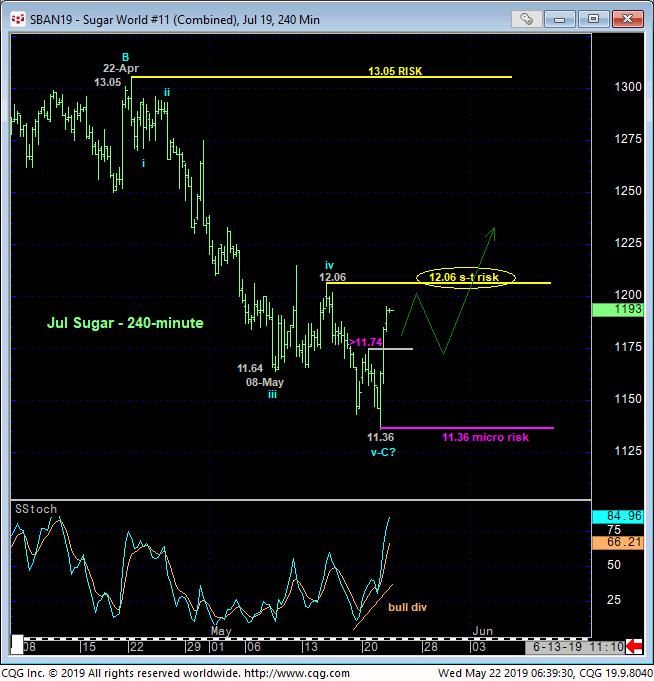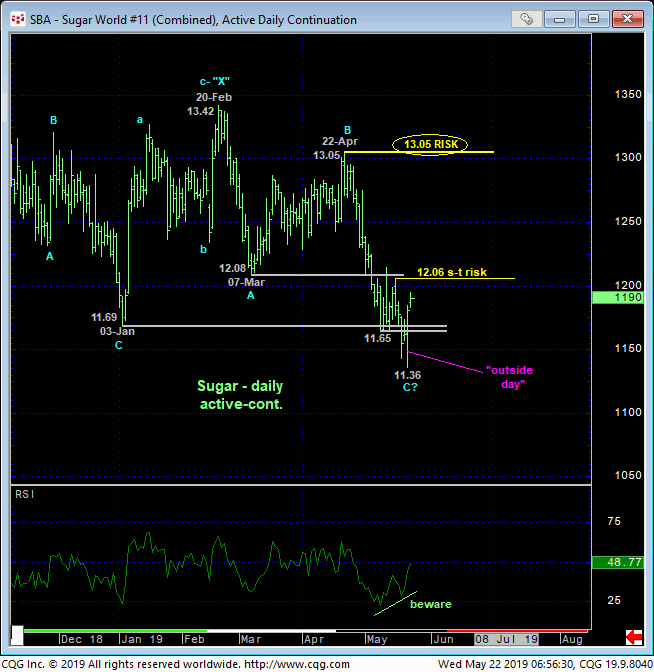
While we still have 15-May’s 12.06 corrective high in place as our short-term risk parameter the market needs to recoup to confirm a bullish divergence in momentum of a sufficient scale to conclude the end of the downtrend from 22-Apr’s 13.05 high, yesterday’s recovery above Mon’s 11.74 very minor corrective high confirms a bullish divergence in very short-term momentum. This micro mo failure leaves yesterday’s 11.36 low in its wake as one of developing importance and a micro risk parameter from which non-bearish decisions like short-covers and cautious bullish punts can now be objectively based and managed.
This micro mo failure is obviously of an insufficient scale to conclude anything more than another interim corrective hiccup relative to a 7-MONTH downtrend from24Oct18’s 14.24 high. However, the ancillary technical facts and considerations listed below are compelling and unique and describe a BASE/REVERSAL threat that could be major in scope. This list starts with what looks to be a textbook 5-wave Elliott sequence down from 22-Apr’s 13.05 high as labeled in the 240-min chart below.


The list of base/reversal-threat factors continues with:
- the market’s failure thus far to sustain this week’s losses below not only 08-May’s 11.65 low, but also 03-Jan’s 11.69 low shown in the daily chart above
- the nicely developing POTENTIAL for a bullish divergence in daily momentum (above)
-
- this divergence will be CONFIRMED above 15-May’s 12.06 corrective high and risk parameter
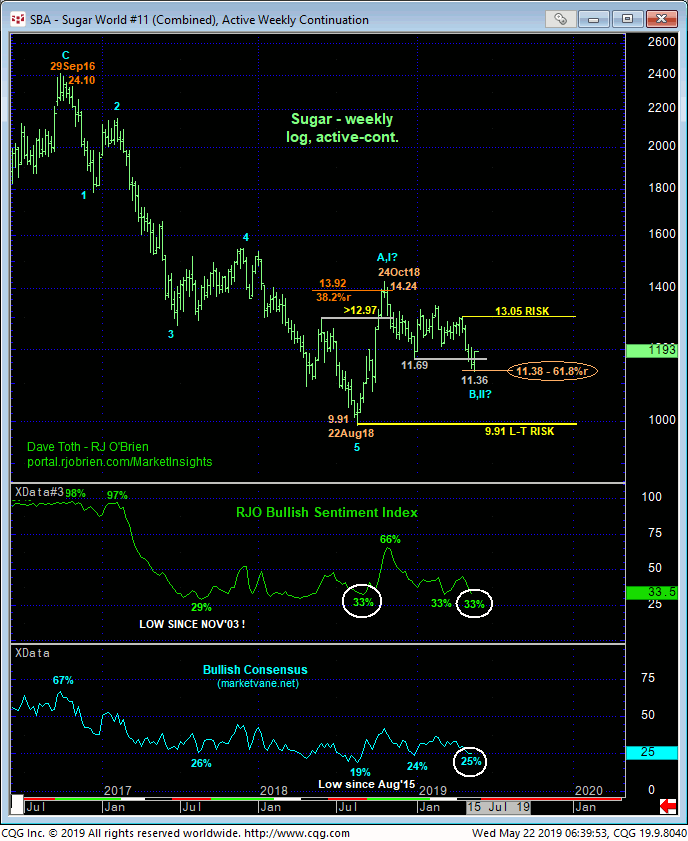
- historically bearish sentiment levels that warned of and accompanied Aug’18’s major low and reversal
- Oct-May’s relapse coming within two ticks of the (11.38) 61.8% retrace of Aug-Oct’18’s 9.91 – 14.24 rally on a weekly log scale basis below and
- yesterday’s “outside day up” (higher high, lower low and higher close than Mon’s range and close).
This is about as compelling and thorough compilation of base/reversal-threat factors as we know. And again, yesterday’s micro mo failure above 11.74 is NOT of a scale to conclude a larger-degree base/reversal count. But sometimes the risk/reward factors line up in such a way that it’s just a pure speculative but objective, almost “raffle ticket” bet that’s worth taking. Per such, traders are advised to move from a bearish policy to a cautious bullish one at-the-market (11.94) with a failure below 11.36 required to negate this call, warrant its cover and reinstate the broader downtrend. Long-term players remains OK to maintain a bearish policy with a recovery above 12.06 required to negate this count, warrant its cover and reinforce a base/reversal count that could be major in scope, including the resumption of a multi-quarter base/reversal process started with Aug-Oct’18’s rally that could produce new highs above Oct’18’s 14.24 high.


