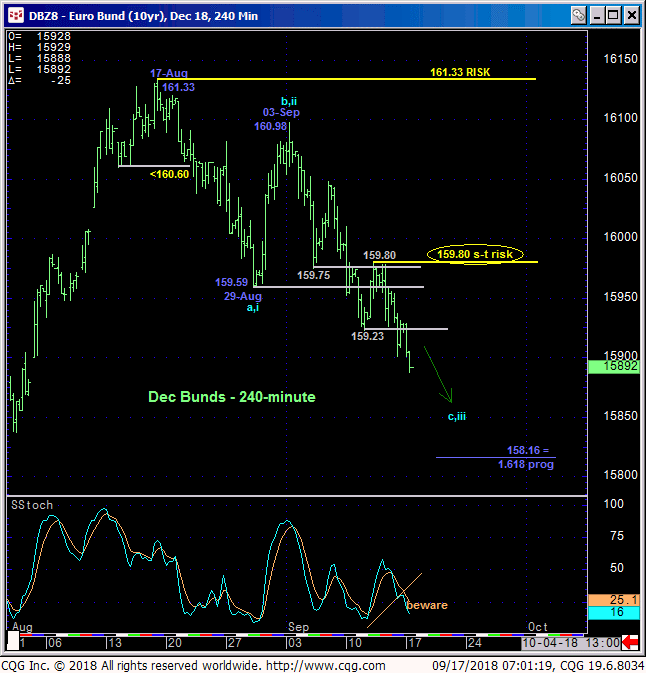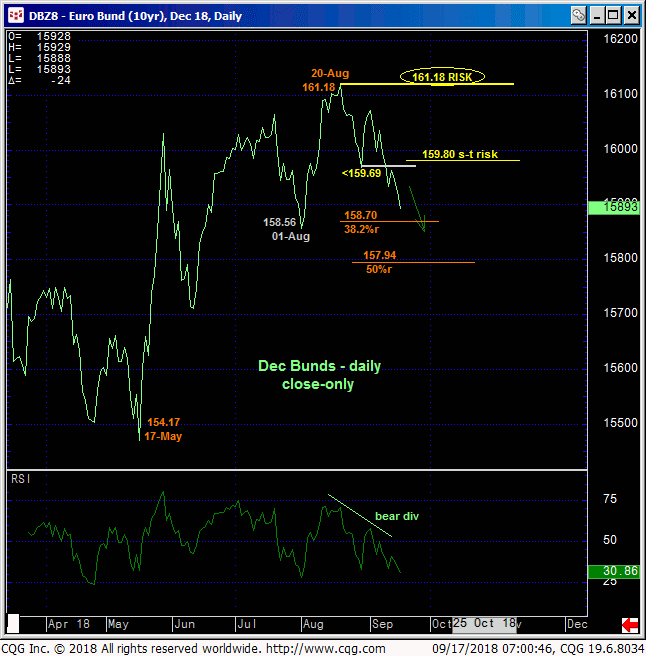
Fri’s break below 11-Sep’s 159.23 low reaffirms our bearish count introduced in 22-Aug’s Technical Blog and leaves 12-Sep’s 159.80 high in its wake as the latest smaller-degree corrective high the market is now minimally required to recoup to arrest the slide and threaten a more immediate bearish count. Per such this 159.80 high is considered our new short-term risk parameter from which shorter-term traders with tighter risk profiles can objectively rebase and manage the risk of an advised bearish policy and exposure. Former 159.23-to-159.59-range support is considered new near-term resistance ahead of further and possibly accelerated losses.


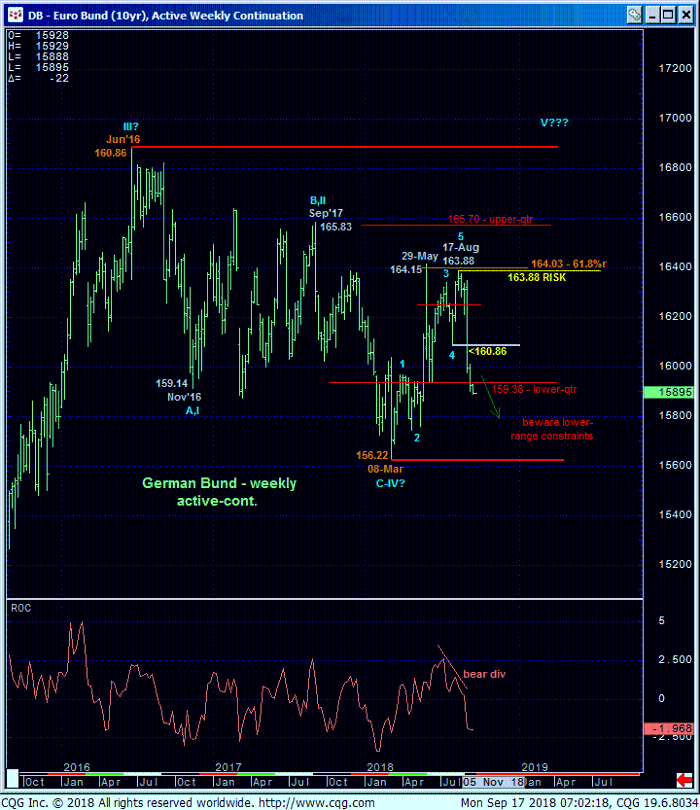
Given the market’s entrapment within the past couple years’ range on a weekly active-continuation chart basis below, and especially as it engages the lower-quarter of this range, the longer-term directional jury remains out as to what this year’s mar-Aug recovery attempt was. Was it just the start of a bigger correction or reversal high to eventual 164+ levels over the next couple quarters, suggesting this current relapse is a corrective buying opportunity? Or was it another Nov’16-to-Feb’17-type component of a major bear market correction ahead of eventual new lows below 156? Longer-term players are urged to acknowledge both possibilities.
What we DO know is this:
- AT LEAST the intermediate-term trend is down
- strength above at least 159.80 is required to threaten a call for further and possibly accelerated losses
- IF the former, bullish count is correct, then the lower-quarter of the past couple years’ range between 159 and 156 would be expected to contain the current corrective sell-off attempt
- a bullish divergence in momentum from this lower-quarter, even on a minor, intra-day basis is minimally required to stem the slide and increase the odds of the bullish count.
Until and unless the market stems the clear and present intermediate-term downtrend with a confirmed bullish divergence in mo above a prior corrective high, there is no way to know that this month’s portion of the decline from 03-Sep’s 160.98 high isn’t the dramatic 3rd-Wave of an eventual 5-wave Elliott sequence down to the 157-handle or below.
These issues considered, a bearish policy and exposure remain advised with strength above 159.80 required to threaten this call enough for shorter-term traders to move to take profits on shorts and move to the sidelines and for longer-term players to pare bearish exposure to more conservative levels. In lieu of such 159.80+ strength, further and possibly accelerated losses remain expected.


