With the U.S. dollar hitting a nine-week low versus major currencies on reports that the U.S. and Canada have not reached an agreement on NAFTA, gold has been trading higher this week. Supporting the bullish move the Commitment of Traders report shows the commercials for the first time in 17 years have become net longs. Watch for the FOMC meeting next Tuesday and Wednesday where according to the CME Fed watch tool there is a 93.2% chance the fed will likely raise rates. Also, keep an eye on developments with Brexit talks with any rejection impacting the pound/euro and therefore the dollar.
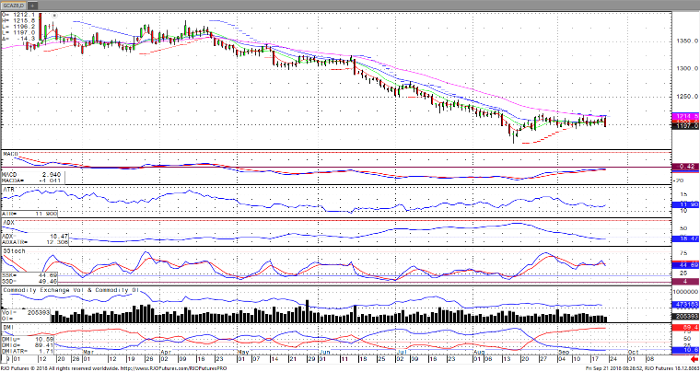
Looking at a December daily gold chart the metal has been trapped in a trading range for the past month with $1192/oz as support and $1216/oz as resistance. Most likely a break above or below these numbers will determine the next trend in the market.
Gold Dec ’18 Daily Chart


