DEC GOLD
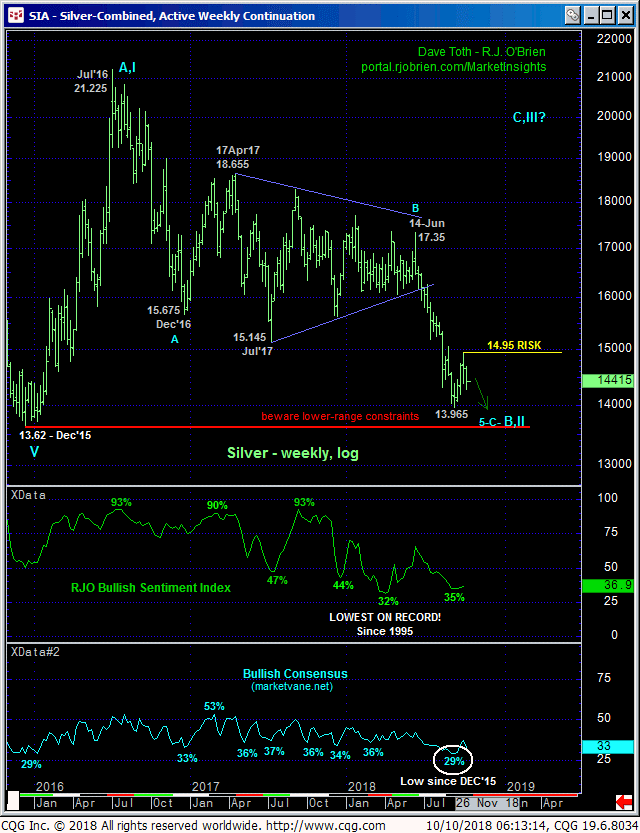
The market’s gross failure to sustain Mon’s impulsive rally and subsequent failure below our 1192.6 short-term risk parameter discussed in Mon’s Technical Blog not only negate our specific bullish count, but also reinforces a broader bearish count that contends the market’s pathetic recovery attempt from 16-Aug’s 1167.1 low is just a correction ahead of 2018’s major downtrend that preceded it. Mon’s relapse obviously defines 02-Oct’s 1212.3 high as one of developing importance and possibly the end of the month-and-a-half correction ahead of the 2018 bear trend’s resumption.
On a smaller scale 04-Oct’s 1199.6 low is considered a minor 1st-Wave low of an eventual 5-wave decline and presumed resumption of this year’s major bear. To maintain the impulsive integrity of a more immediate bearish count the market now needs to sustain losses below 1199.6. Per such, we’re marking the 1200 level as our new short-term risk parameter from which a resumed bearish policy can be objectively based and man aged by shorter-term traders. That 1212.3 high is our new long-term bear risk parameter for longer-term players.
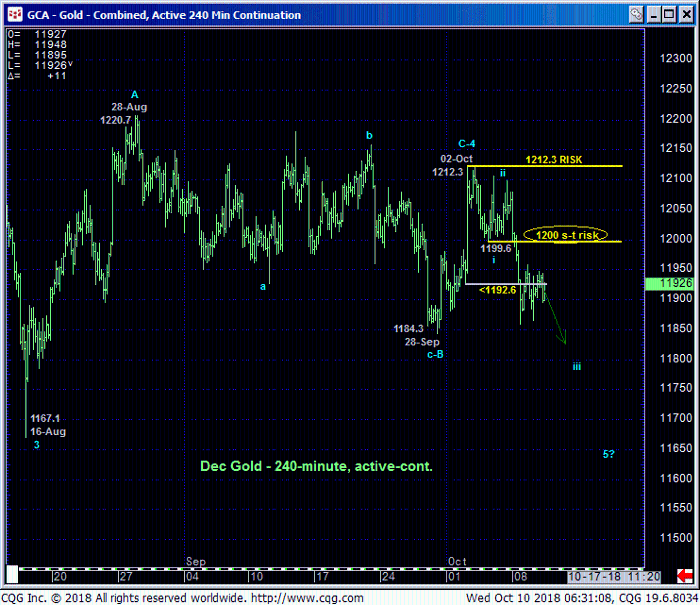
Indeed, the daily close-only chart above shows how pathetic the recovery attempt from 16-Aug’s 1184 low close has been. Against the backdrop of Apr-Aug’s meltdown this shallow, lateral chop is about as corrective and consolidative as it gets and warns of a resumption of the downtrend that preceded it. A close above 27-Aug’s 1216 high is required to threaten this bearish call and resurrect a broader base/reversal count.
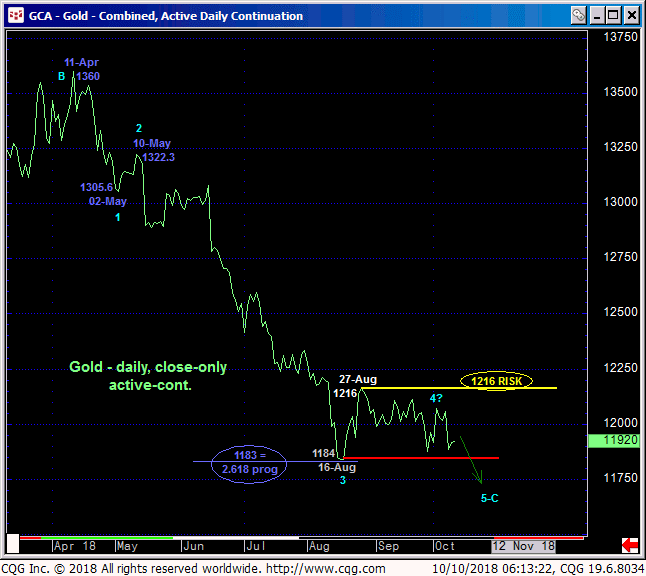
It’s interesting to note that the decline from 10-May’s 1322.3 2nd-Wave high spanned a length exactly 2.618-times (i.e. 2.618 progression) that of Apr-May’s initial 1360 – 1305.6 1st-Wave. This Fibonacci fact suggests that that 1184 low completed the 3rd-Wave of an eventual 5-wave sequence down that only has its final 5th-Wave down to new lows below 1184 to complete the sequence and offer what could be an outstanding risk/reward long-term buy. After all, the market is once again flirting with the lower-quarter of a 2-YEAR range amidst sentiment/contrary opinion levels that haven’t been seen in 17 years. But as always when navigating a base/reversal-threat environment, it all starts with MOMENTUM, and a market’s inability to sustain those new (5th-wave) lows via a recovery above a prior (4th-wave) corrective high like 1216. We can only cross that bridge when we come to it.
These issues considered, traders are advised to return to a bearish policy, albeit a more cautious, conservative one from 1195 OB with a recovery above at least 1200 required to defer this call and further strength above 1212.3 to negate it. IN lieu of such strength we anticipate a resumption of this year’s major bear trend to new lows below at least 1184 and possibly below 1167.
DEC SILVER
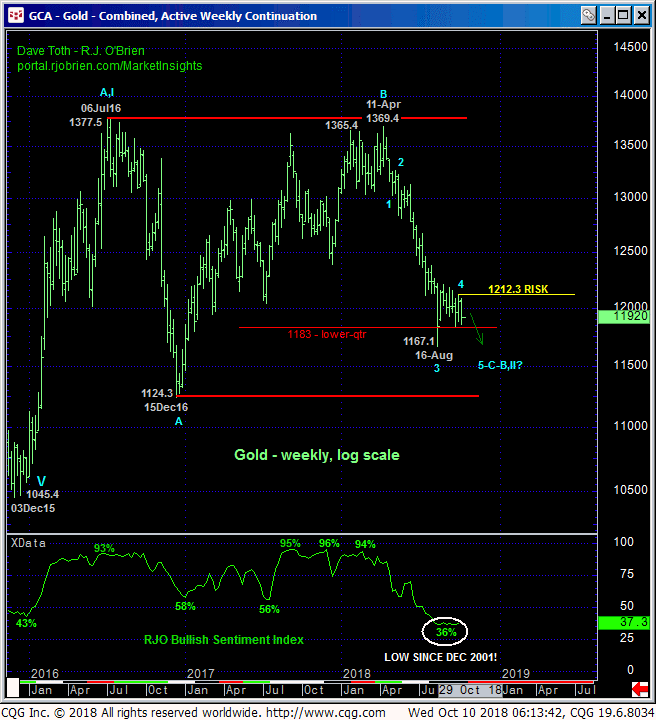
The technical construct and expectations for the silver market after Mon’s failure below our short-term risk parameter at 14.395 are virtually identical to those detailed above in gold, re-exposing 2018’s major downtrend. Fri’s 14.75 smaller-degree corrective high and 02-Oct’s 14.95 larger-degree corrective high serve as our new short- and longer-term risk parameters from which a resumed bearish policy and exposure can be objectively based and managed.
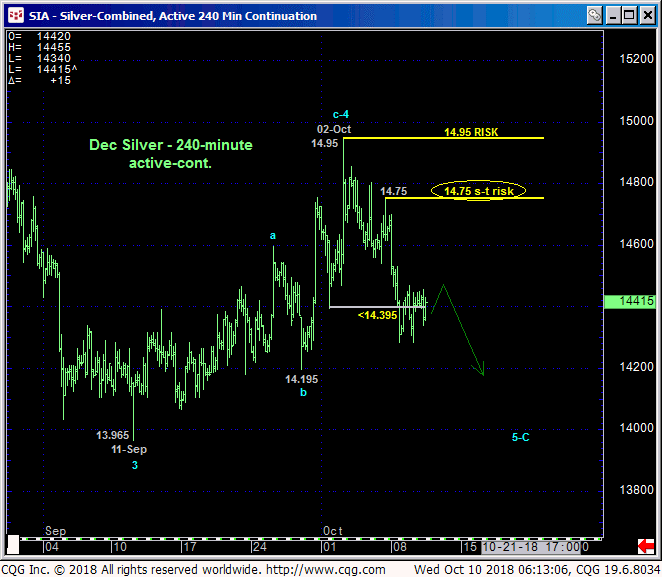
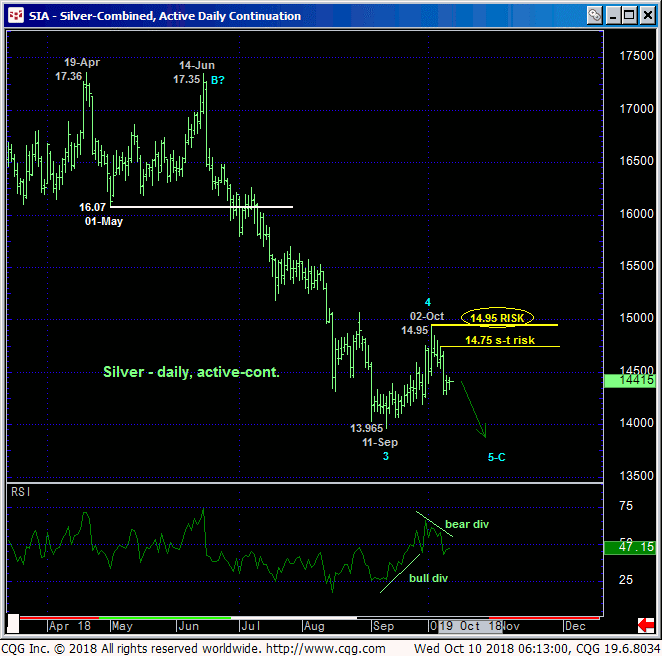 In lieu of a recovery above these levels we anticipate a run to another round of new lows below 11-Sep’s 13.965 low. Traders are urged to keep a keen eye on momentum however, and the market’s ability to SUSTAIN sub-13.965 losses given its proximity to the extreme lower recesses of the THREE YEAR range where a broader base/reversal-threat remains a possibility given understandably historically bearish sentiment levels.
In sum, a cautiously bearish policy is advised from the 14.47 level OB with a recovery above 14.75 required to negate this call. Given the market’s position in the middle of the past month’s range however, aimless whipsaw risk typical of such range-center environs should also not surprise.
