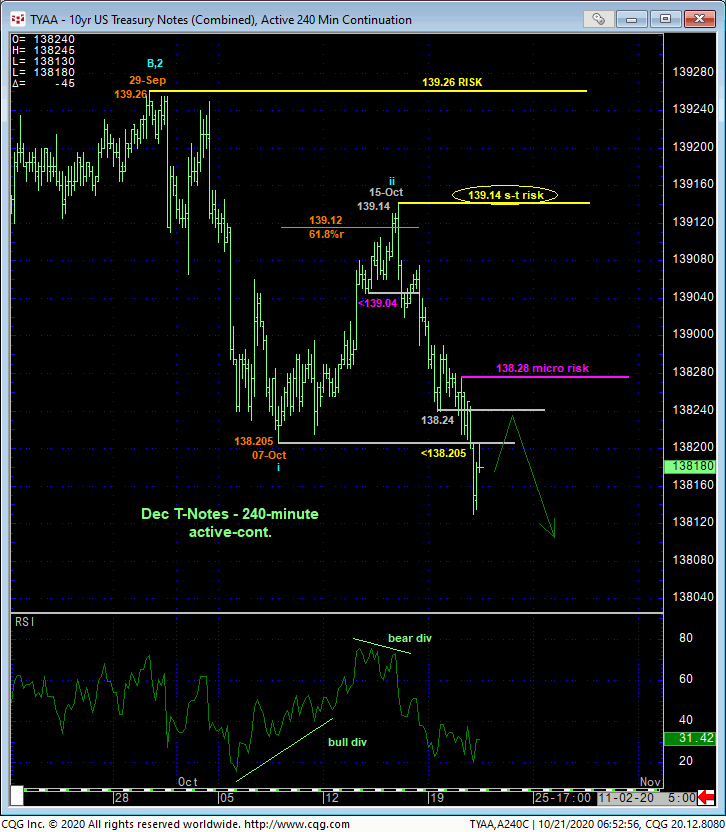
Overnight’s clear break below 07-Oct’s 138.205 low is the latest reinforcing evidence of our major peak/reversal count introduced in 11-Aug’s Technical Webcast. This sub-138.205 break obviously identifies 15-Oct’s 139.14 high and near-61.8% retrace of late-Sep/early-Oct’s 139.26 – 138.205 decline as the end of yet another corrective rebound attempt consistent with this broader peak/reversal-threat environment. Per such, this 139.14 high serves as our new short-term risk parameter from which shorter-term traders can objectively rebase and manage the risk of a still-advised bearish policy.
From an even shorter-term perspective and while now acknowledging former 138.21-to-138.24-area support as new near-term resistance, a very minor corrective high from yesterday morning at 138.28 serves as a micro risk parameter we don’t believe the market should be able to recoup per a more immediate continuation of the developing bear.
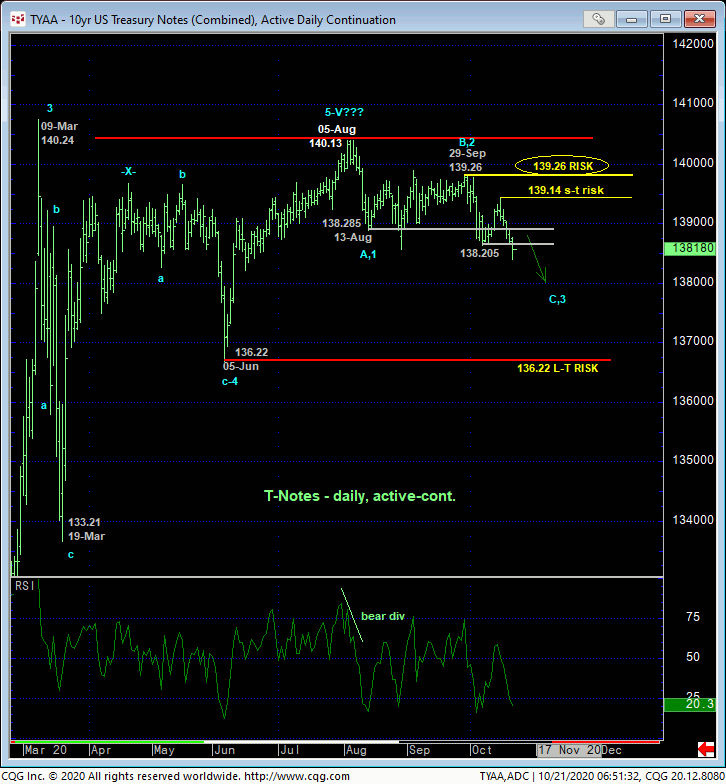
The daily chart of the contract above shows the market now below the past TWO MONTHS’ support from the 138.28-to-138.21-area that, since broken, would be expected to hold as new resistance within this broader peak/reversal process. To be sure, the sell-off attempt THUS FAR from 05-Aug’s 140.13 is only a 3-wave structure, so it’d be premature to discount an alternate bullish count that would suggest the past 2-1/2-month setback is merely another correction within the 2-YEAR secular bull. But of this is the case, the market needs to PROVE Aug-Oct’s decline is a 3-wave and thus corrective event by recovery above 29-Sep’s 139.26 high. Until and unless such strength is proven, the decline from 139.26 could be the dramatic 3rd-Wave of a major reversal lower that would not surprise by accelerated and increasingly obvious behavior lower.
On a 10-yr yield basis, the daily close-only chart below shows today’s recovery above 07-Oct’s 0.787% high that nullifies 13-Oct’s bearish divergence in short-term mo and exposes an area devoid of any levels of technical merit shy of 05-Jun’s hugely pivotal 0.898% high, the recovery above which would arguably break the 2-YEAR downtrend in rates from Oct’18’s 3.237% high. This key 0.898% threshold is analogous to 05-Jun’s 136.22 larger-degree corrective low and key long-term risk parameter.
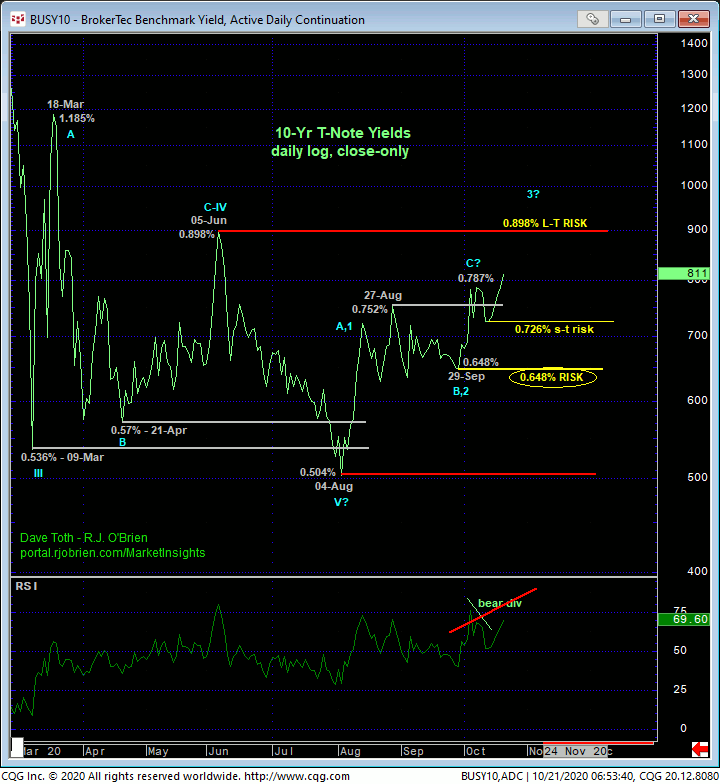
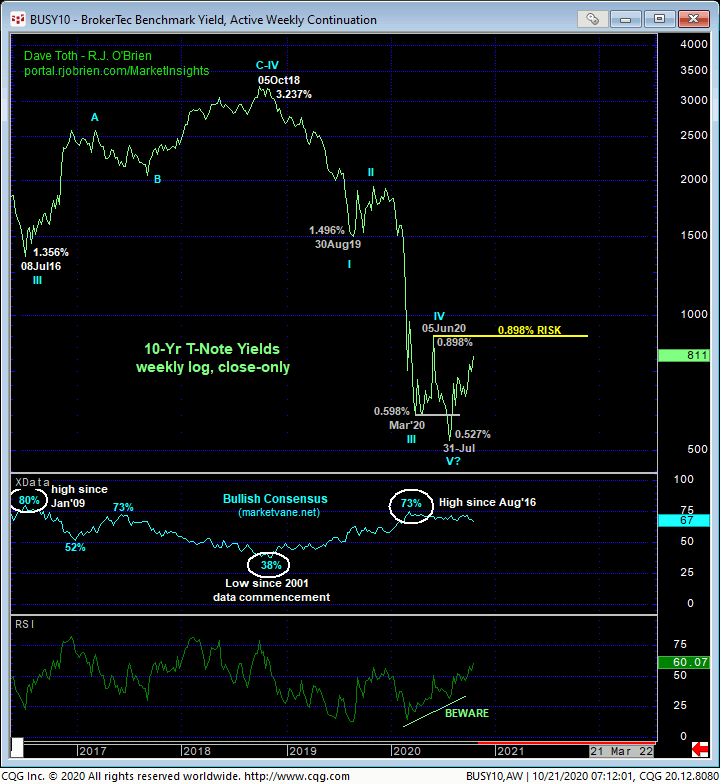
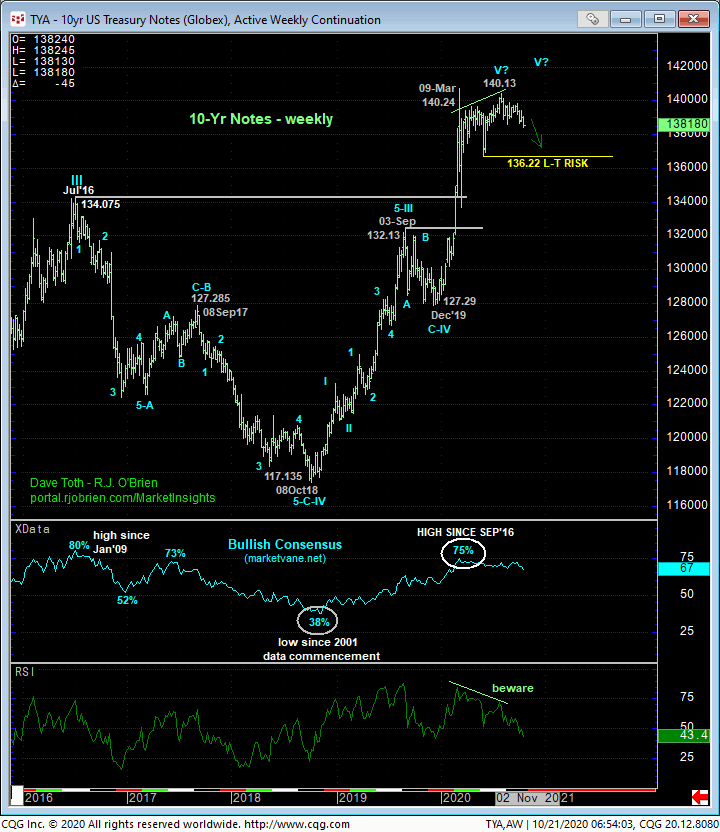
The weekly log close-only chart of rates above and weekly chart of the contract below show the nicely developing potential for momentum divergence on a massive scale that, if confirmed (above 0.898% and below 136.22), would break the 2-YEAR trends from Oct’18’s high in rates and low in the contract. Combined with the argument that these 2-year trend have completed 5-wave Elliott sequences as labeled amidst historically frothy sentiment/contrary opinion levels that haven’t been seen since those that warned of and accompanied Jul’16’s major peak/reversal, it’s not hard to envision today’s weakness below 138.205 as a contributing element to our major peak/reversal count in the contract.
These issues considered, a bearish policy and exposure remain advised for long-term institutional players with a recovery above 139.26 required to negate this call and warrant its cover. A bearish policy and exposure remain advised for shorter-term traders with a recovery above 139.14 required to defer or threaten a more immediate bearish count enough to warrant its cover. For those wanting to play a bearish punt very close-to-the-vest, protective buy-stops just above 138.28 are advised. In lieu of such strength, further and possibly accelerated losses are anticipated straight away with former 138.21-to-138.24-area support considered new near-term resistance.
