MAR 10-Yr T-NOTES
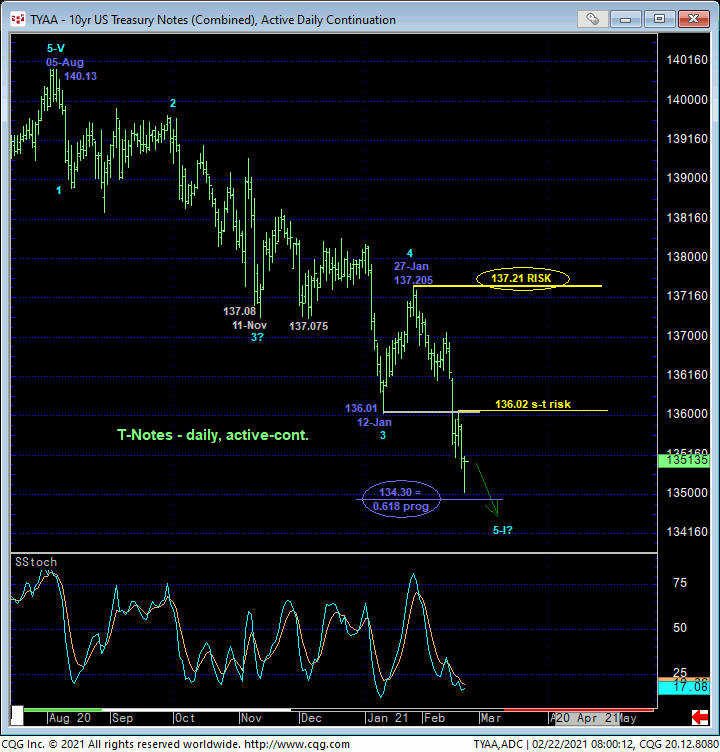
The 240-min chart below shows that Fri and overnight’s break below last Wed’s 135.15 low reaffirms the developing bear trend and leaves Thur’s 136.02 high in its wake as the latest smaller-degree corrective high this market s now minimally required to recoup to even defer, let alone threaten the clear and present and increasingly major downtrend from last Aug’s 140.13 all-time high. Per such, this 136.02 level serves as our new short-term but important risk parameter from which traders can objectively rebase and manage the risk of a still-advised bearish policy and exposure.
Former 135-1/2-area support is considered new near-term resistance.

The daily chart below shows the past week’s continuation and acceleration of our major bearish count introduced in 11Aug20’s Technical Webcast that maintains 27-Jan’s 137.21 larger-degree corrective high as our key long-term risk parameter this market is required to recoup to break this major bear trend. Former 136.00-area support has thus far played its role well as new resistance and remans a key resistance candidate. Initial and admittedly smaller-degree strength above our short-term risk parameter at 136.02 would be an early indication and minimum requirement to such a larger-degree momentum failure above 137.21.
From a geeky Elliott Wave and Fibonacci perspective, it could prove interesting that the decline from 27-Jan’s 137.21 high is the prospective completing 5th-Wave of the entire sequence down from 05Aug20’s 140.13 high and that this prospective 5th-Wave came within 3/32s of its (134.30) 0.618 progression of the net distance of prospective Waves-1-thru-3 (140.13 – 136.01). As always however, this merely “derived” Fibonacci level and wave count mean absolutely nothing until and unless the market even threatens (above 136.02), let alone negates (above 137.21) the clear and present and major downtrend.
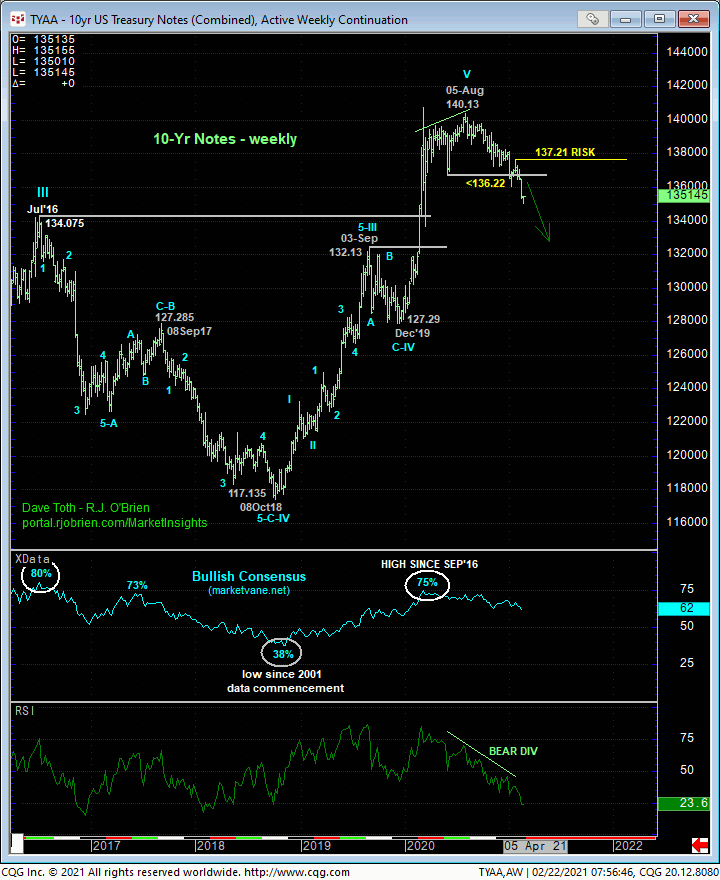
The weekly chart below is showing the ultimate pay-off to months-long peak/reversal advocates in the form of accelerating downside pressures. We have equated the peaking behavior that dates from last Mar’20 to the multi-quarter base/reversal action that stemmed 2016-2018’s downtrend and exposed a nearly TWO-YEAR bull. The break of Oct’18 – Aug’20’s 117.13 – 140.13 major uptrend is clear following the opportunistic combination of factors typical of major reversals last Aug:
- a confirmed bearish divergence in momentum
- historically frothy bullish sentiment
- a complete 5-wave Elliott sequence.
NOW, the challenge of navigating what could be a reversal of massive, generational scope could pose some extensive twists.
On a daily yield basis below, we’ve identified smaller- and larger-degree corrective lows at 1.272% and 1.018%, respectively. These levels are analogous to 136.02 and 137.21 in the contract. The trend in rates is clearly up and should not surprise by its continuation or acceleration straight away. HOWEVER…..


…On a massive, long-term basis, the monthly log scale chart above and quarterly log scale basis below show the market’s engagement of the 1.37%-area that market nearly EIGHT YEARS of support from Jul’12 until Feb’20’s meltdown. This massive former support cannot be overlooked as key resistance in what could be an extended period ahead. Additionally, 1.374% is the 38.2% retrace of the entire, generation-long decline in rates from 1981’s 15.84% high to last Mar’s 0.303% low. And if that’s not enough, 1.313% is the 61.8% retrace of 2018-2020’s 3.261% – 0.303% decline. If there’s a time and place to be watchful for the current rate rise from last 04Aug20’s 0.504% low daily close to run out of steam with a momentum failure that could mark the end of a 5-wave rally from that low, it is here and now. The risk parameters we’ve identified above- 136.02 and 137.21 in the contract and 1.272% and 1.018% in yield- will be the precise levels around which we’ll navigate this development and risk. Until and unless the market recovers (relapses) below these prices level (rates), the clear and present trend should not surprise by its continuance or acceleration.
In sum, a bearish policy remains advised with a recovery above at least 136.02 and preferably 137.21 required to threaten and then negate this call and warrant defensive measures commensurate with one’s personal risk profile.

MAR GERMAN BUNDS
Similarly, Fri and overnight’s break below last Wed’s 174.38 low in the Mar bunds reaffirms the developing bear trend and leaves Thur’s 175.26 high in its wake as the latest smaller-degree corrective high and minimum level this market needs to recoup to confirm a bullish divergence in short-term momentum, stem the slide and expose at least an interim corrective hiccup. Per such, this 175.26 level serves as our new short-term risk parameter from which shorter-term traders with tighter risk profiles can objectively rebase and manage the risk of a still-advised bearish policy.
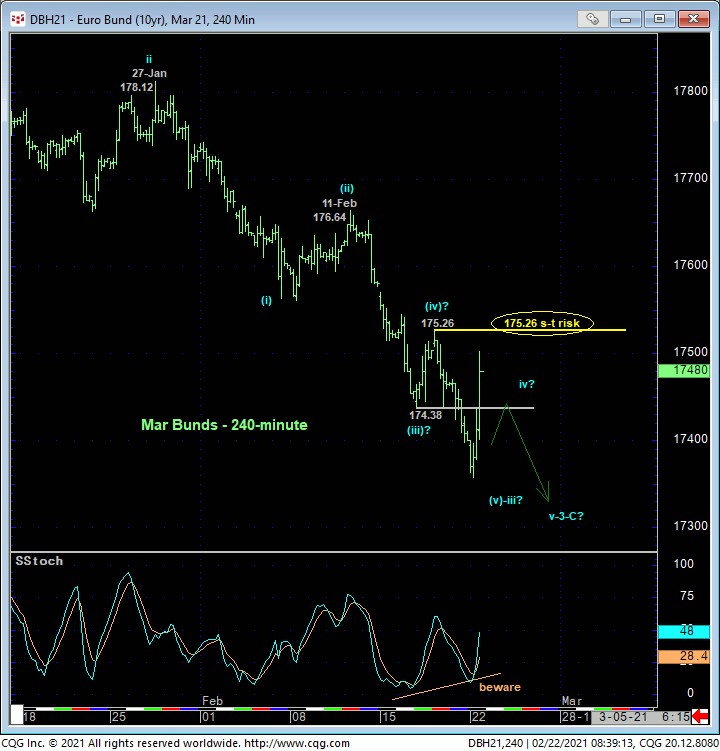
From a longer-term perspective, the extent and impulsiveness of the decline from 11-Dec’s 178.59 high is characteristic of a 3rd-wave and reinforces our broader peak/reversal count from last Nov’s 178.85 high daily close as labeled in the daily close-only chart below. We’ve noted 12-Jan’s 176.77 low as the end of a smaller-degree 1st-Wave within the broader decline from that 11-Dec high and one that this market should not be able to even come close to, let alone break, per our broader bearish count. Per such, this 176.77 level serves as our new long-term risk parameter to a still-advised bearish policy and exposure for longer-term institutional players.

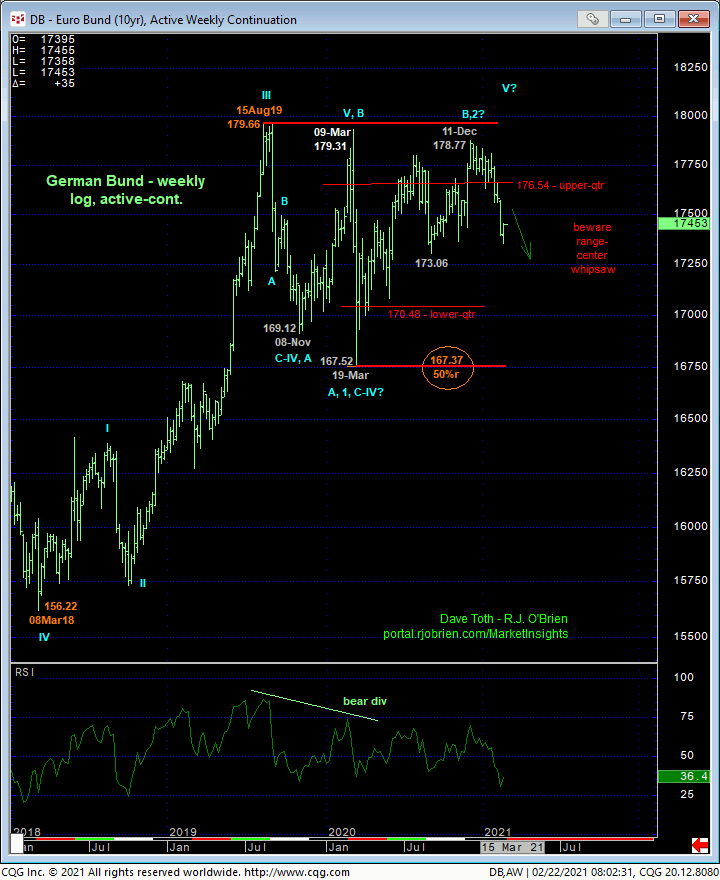
If there’s a risk or deferral to our bearish count, its the fact that this market has returned to the middle-half bowels of its massive 18-month lateral range on a weekly log active-continuation basis. Such range-center environs are fertile ground for aimless whipsaw risk and poor conditions from which to initiate directional exposure. But if this market is poised for multi-week or multi-month lateral chop, then somewhere along the line it’s got to arrest the clear and present and potentially major downtrend with a countering bullish divergence in momentum. Herein lies the importance of even tighter corrective highs and risk parameters like 175.26.
These issues considered, a bearish policy remains advised with a recovery above 175.26 required for shorter-term traders to take profits and move to the sidelines to circumvent the heights unknown of what will first be approached as a slightly larger-degree bear market correction. Commensurately larger-degree strength above 176.77 is required for longer-term institutional players to follow suit.