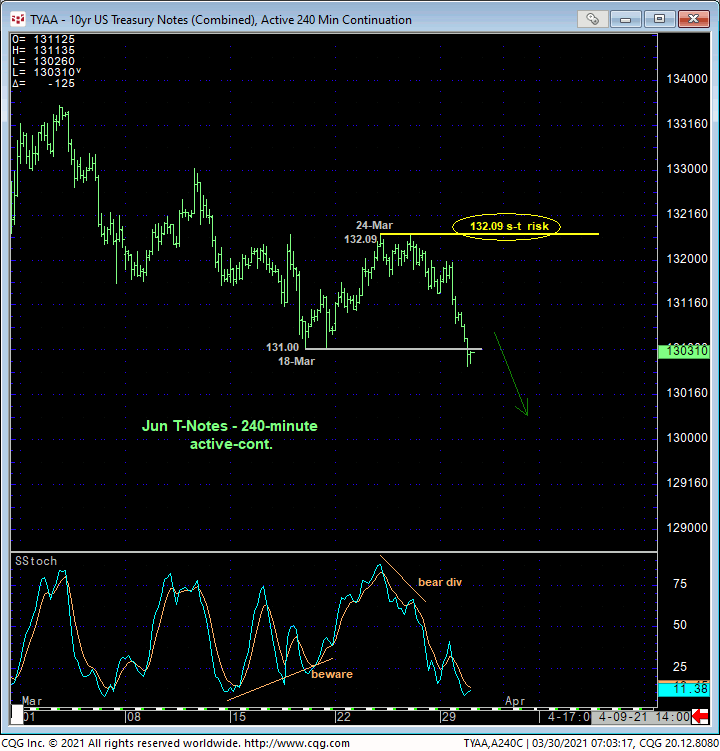
Overnight’s break below 18-Mar’s 131.0 low reaffirms the developing and major downtrend and leaves 24-Mar’s 132.09 high in its wake as the latest smaller-degree corrective high this market is now minimally required to recoup to even defer, let alone threaten the clear and present and major downtrend. Per such, this 132.09 levels remains intact as our short-term but key risk parameter from which traders can rebase and manage the risk of a still-advised bearish policy and exposure.

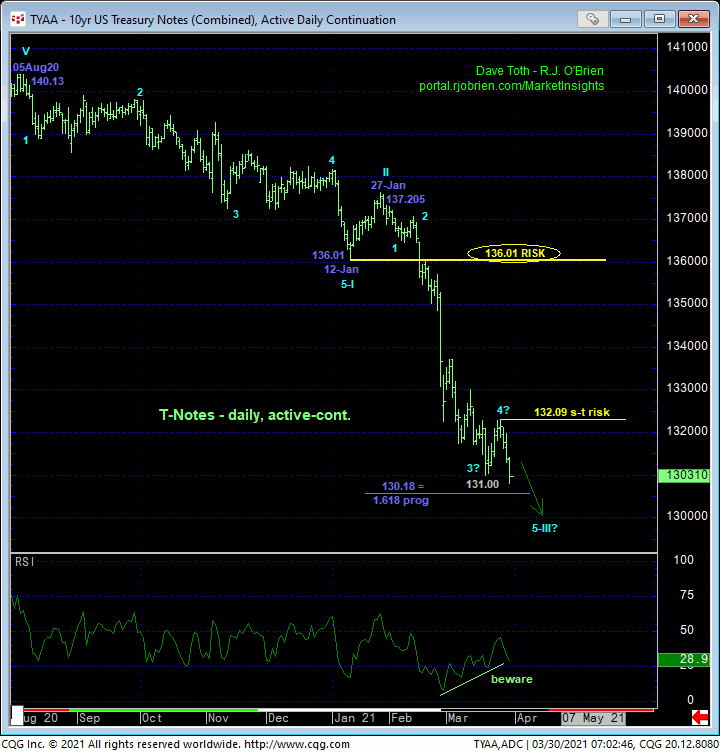
From a longer-term perspective, the daily chart below clearly shows the magnitude of sustained, trendy impulsiveness of this still-developing major downtrend and reversal. But while a short-term momentum failure above 132.09 will hardly suffice in concluding an end to this collapse, such a divergence nonetheless provides a more acute and practical opportunity to take defensive measures to a bearish policy commensurate with one’s personal risk profile (i.e. short-term traders neutralize exposure; longer-term players pare exposure).
The steep, accelerated, 3rd-wave nature of the past month’s portion of the decline obviously reinforces this count. But this leaves little in the way of a practical longer-term risk parameter. We’ve marked 12-Jan’s 136.01 as the end of the 1st-Wave down to an eventual and major 5-wave sequence down. “Theoretically” at least (for what that’s worth), any recovery shy of 136.01 could still constitute a mere correction within the broader bear. A recovery above 136.01 is required to jeopardize the impulsive integrity of this major bearish count. But such a longer-term risk parameter really isn’t very practical at this juncture, even for long-term commercial players. Per such, we’d advise even long-term players to at least pare bearish exposure to more conservative levels if/when the market recovers above 132.09 to reduce the risk of a corrective rebound of what at that point would be indeterminable scope. Above 132.09, there would be no objective way whatsoever to know if the correction would only be to the 133-handle or the 134-handle or more. Until and unless such 132.09+ strength s proven however, the trend remains down on all scales and should not surprise by its continuance or acceleration.

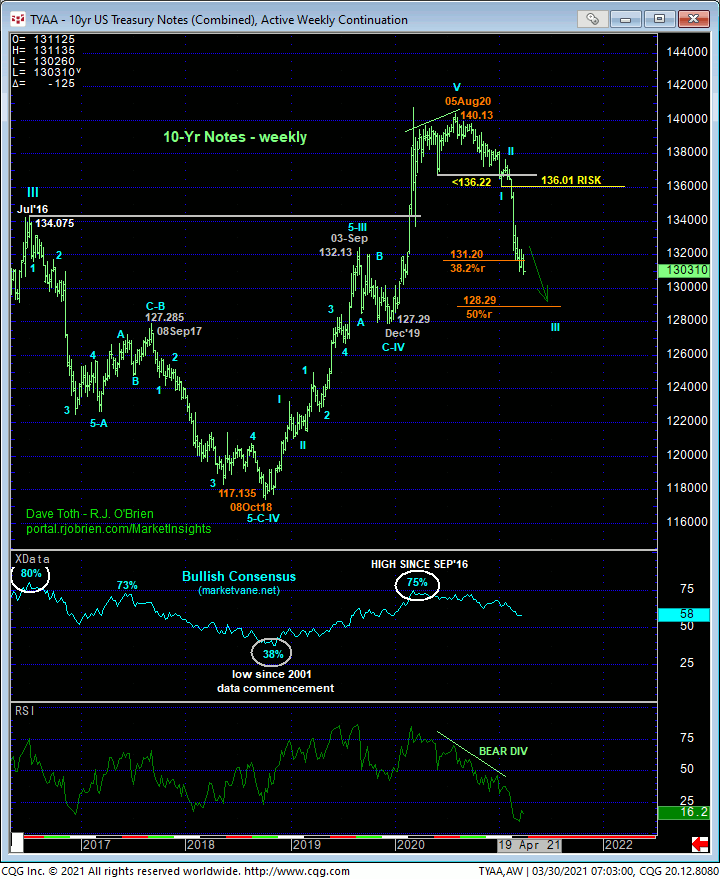
On an even broader scale, it’s easy to see the magnitude and dominance of the new major bear trend and massive peak/reversal in the weekly chart below. Just like 2018’s base/reversal process, 2020’s peak/reversal process took months, quarters even before the other shoe finally dropped, exposing steep, sustained losses. When 2018’s base/reversal was finally confirmed in Dec’18, the bull didn’t look back. It sustained trendy, impulsive behavior until at least threatened by a larger-degree correction in Sep’19 that lasted three months. There’s little question that we will see such intermediate-to-larger-degree corrective rebounds to this current major bear trend. But such consolidative interruptions have to begin with a confirmed bullish divergence in momentum above a prior corrective high and risk parameter like 132.09.
These issues considered, a full and aggressive bearish policy and exposure remain advised with a recovery above 132.09 required to defer this call enough warrant paring or neutralizing exposure in order to circumvent the heights unknown of what at that point would be considered an interim corrective recovery. In lieu of such 132.09+ strength, the trend remains down on all scales and should not surprise by its continuance or acceleration.


