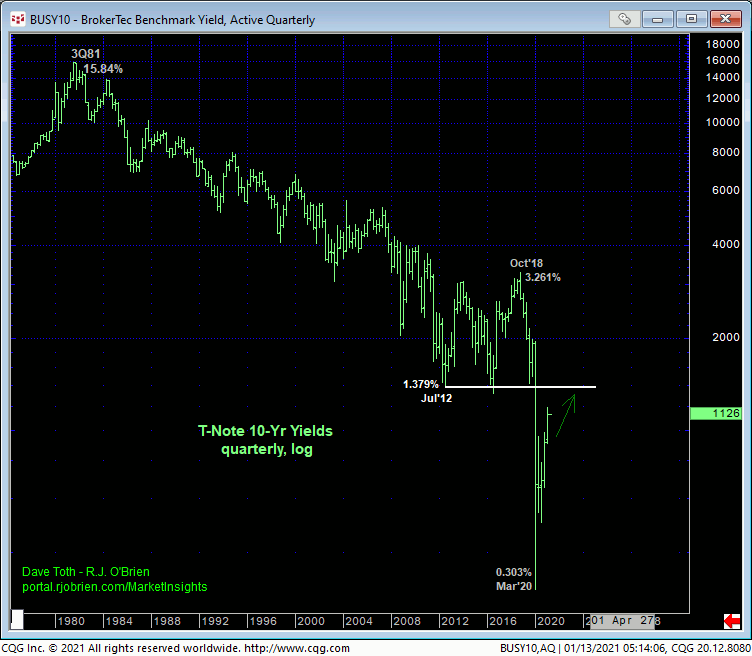
While it’s taken awhile (five months) to confirm, this past Fri’s break below 05Jun20’s 136.22 low confirms the bearish divergence in WEEKLY momentum that breaks the 2-year bull trend from Oct’18’s 117.13 low and our major peak/reversal count introduced in 11-Aug’s Technical Webcast. This major momentum failure confirms 05Aug20’s 140.13 high as the END of a 5-wave Elliott sequence from 117.13 and THE high and risk parameter the market is required to recoup to negate a peak/reversal threat that could be generational in scope. While we discuss tighter and more practical bear risk parameters below, the expected major reversal lower could span years with indeterminable and massive downside potential.
Looking towards the months and quarters ahead, the next major downside threshold this bear will engage is the 135-to-134-handle-area that marked multi-year resistance from 2012-thru-2016 before Feb’20’s breakout above this area left it as a major new support candidate.
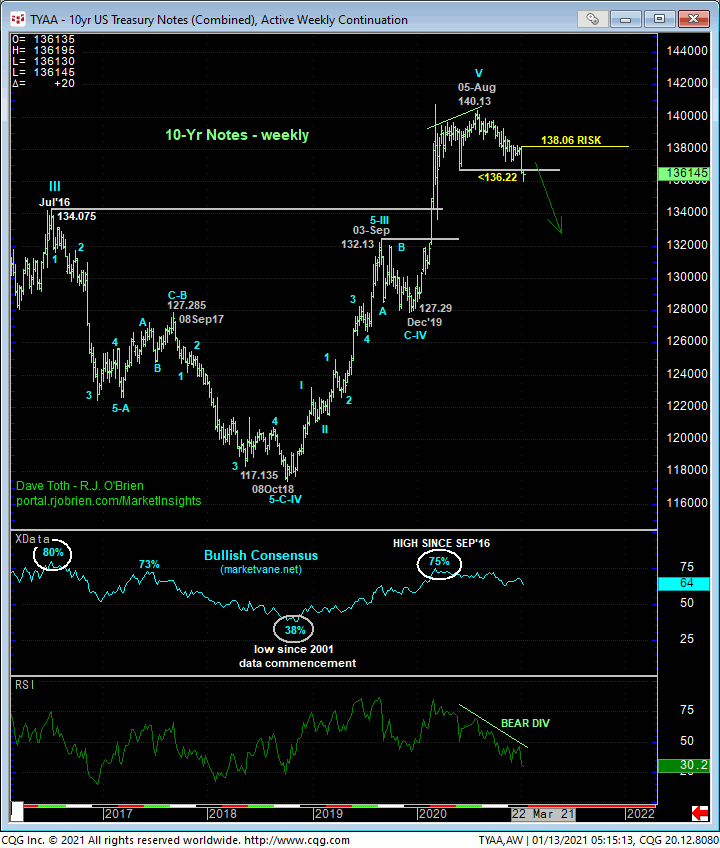
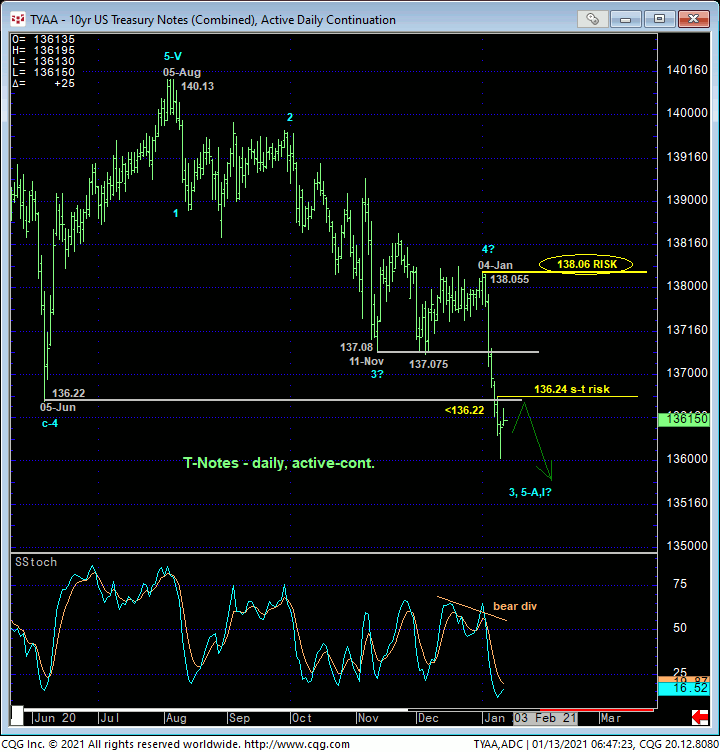
The extent and impulsiveness of early-Jan’s continuation of this major reversal are clear in the daily chart above and 240-min chart below. This price action obviously defines 04-Jan’s 138.055 high as the latest larger-degree corrective high the market is now required to recoup to arrest the 5-month downtrend as the initial and major 1st-Wave of the broader peak/reversal process that would then expose the 2nd-Wave corrective rebuttal higher. Until and unless such 138.055+ strength is shown, there’s no way to know the market isn’t IN the dramatic 3rd-Wave down that wouldn’t/shouldn’t look back ahead of protracted losses straight away.
ON a short-term basis detailed in the 240-min chart below, this week’s continuation of the slide leaves Mon’s 136.24 high in its wake as the latest smaller-degree corrective high the market needs to sustain losses below to avoid confirming a bullish divergence in short-term momentum that would expose at least a correction of Jan’s portion of the bear from its 138.055 high. Per such, this 136.24 level serves as our new short-term risk parameter from which shorter-term traders with tighter risk profiles can objectively rebase and manage the risk of a still-advised bearish policy and exposure.
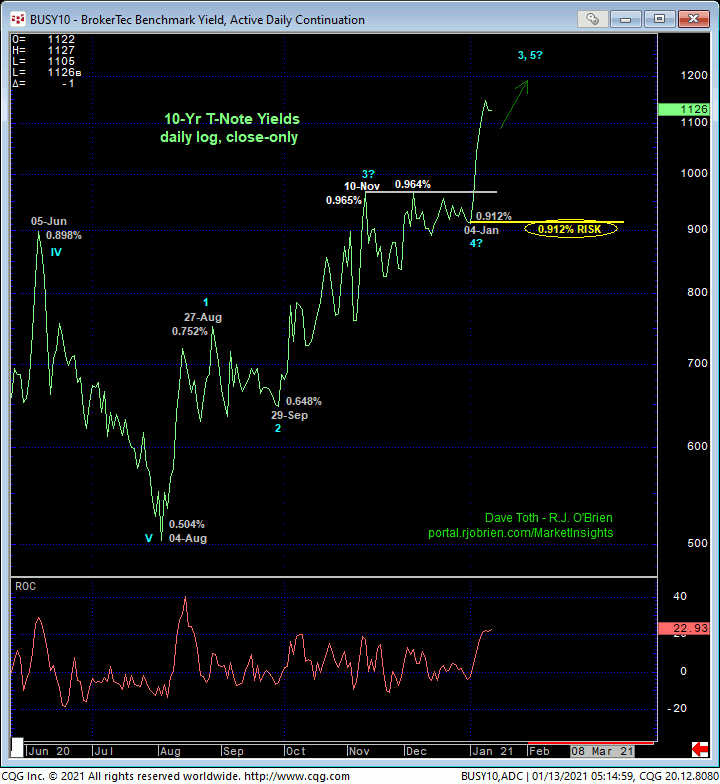
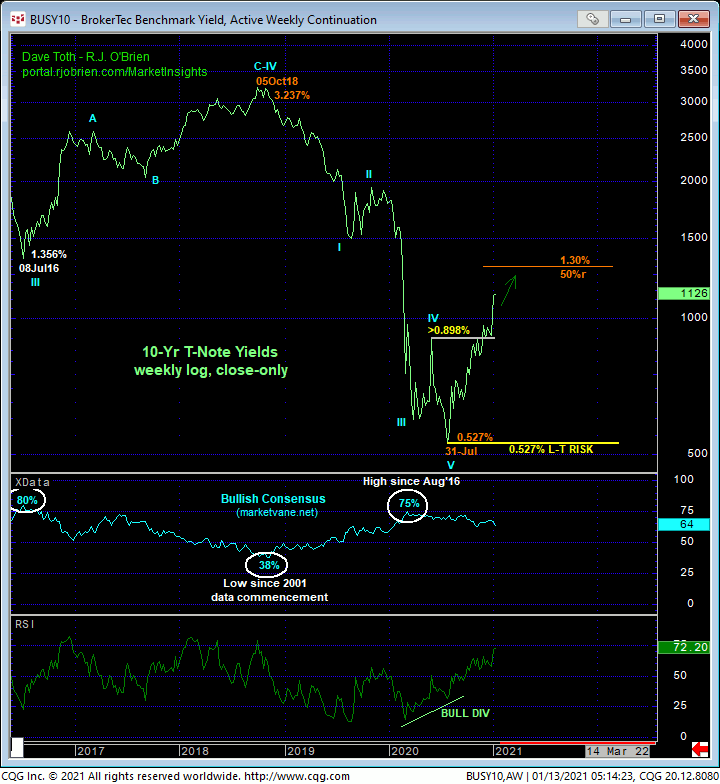
From a 10-yr yield perspective, the daily log close-only chart above shows early-Jan’s impressive, impulsive resumption of the new and major reversal higher in rates, leaving 04-Jan’s 0.912% corrective low as the new longer-term risk parameter from which an advised policy calling for higher rates can be objectively rebased and managed. The weekly log close-only chart below shows the trifecta that’s typical of a major base/reversal environment:
- a confirmed bullish divergence in momentum amidst
- historically frothy levels of bullish sentiment not seen since that that warned of and accompanied Jul’16’s base/reversal
- a complete and textbook 5-wave Elliott sequence down from Oct’18’s 3.237% high.
Until nullified by a relapse below Jul’s 0.527% low weekly close and very long-term risk parameter, a reversal higher in rates that could be generational in scope is hard to ignore.
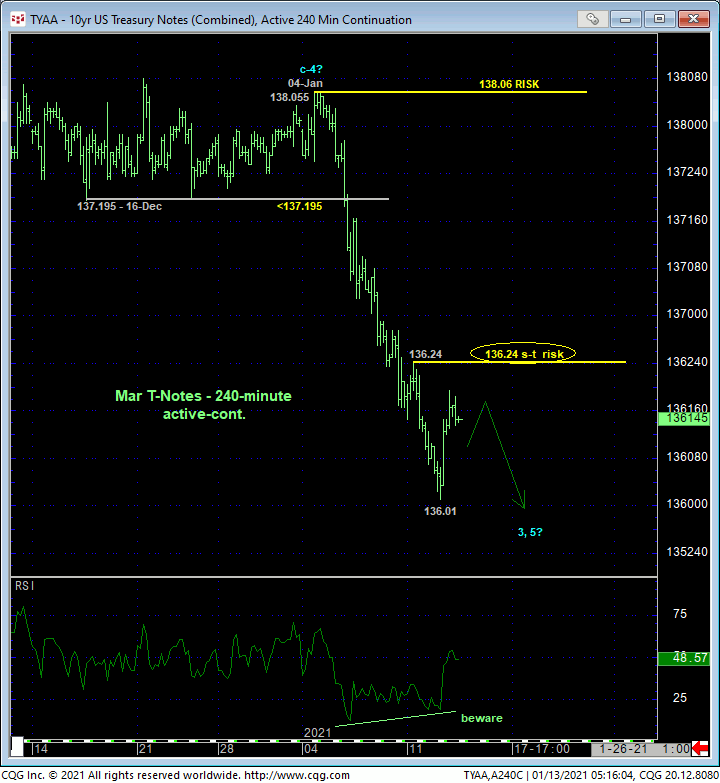
With respect to moves that could be generational in scope, the quarterly log scale chart of 10-yr rates below provides an interesting perspective. Those of us who’ve been involved with the rate markets since the early-80s Volcker years were on hand to experience a reversal that truly proved to be generational in scope. Perhaps like Mark Twain coming in and going out with Haley’s comet, we’ll be able to experience another such generational reversal in our twilight.
To be sure, this historical perspective shows massive former support around the 1.40%-area that is hard to ignore as a new resistance candidate that could “contain” the rate reversal for a protracted amount of time. Oct’18’s 3.261% massive corrective high is THE long-term threshold rates need to recoup to, in fact, break the nearly-40-year bear trend in rates and usher in a probable era of inflation that many thought may never be seen again. But we can only address these 1.40% and 3.26% bridges as we get to them. In the meantime, the new long-term trend in rates is up until and unless deferred or threatened by a failure below our 0.912% risk parameter. This is a technical fact.
With respect to the contract, a full and aggressive bearish policy and exposure remain advised with a recovery above 136.24 required for shorter-term traders to take profits and move temporarily to the sidelines and commensurately larger-degree strength above 138.06 required for longer-term institutional players to follow suit. In lieu of such strength, the trend is down on all scales and should not surprise by its continuance or acceleration.
