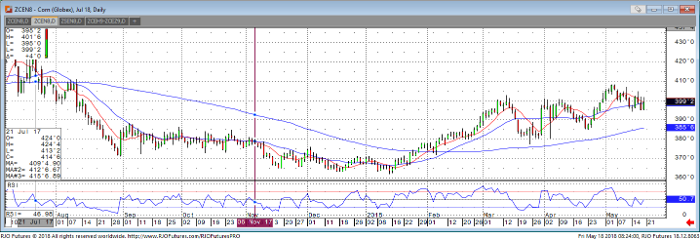
The corn market has chopped sideways this week after last week’s trade lower off the 408^2 highs. The market remains in an indecisive state with outside forces remaining bearish and many unknowns from the growing season ahead. Increasing trade pressures with China, NAFTA negotiation delays, and a stronger dollar are currently holding the market from running higher. Weather in the northern growing regions is not ideal for finishing planting but warmer and moist conditions in the Midwest are good for corn already in the ground. Weekly planting progress showed 62% planted, compared to 39% last week, which is lower than last year’s 68% and the ten-year average of 65%. July corn is trading off support at 395^0 with second support coming in around 389^6. Resistance is at 400^4 and at the highs of 408^2. The December contract sees support at 412^6 and resistance at 420^2.
Corn Jul ’18 Daily Chart

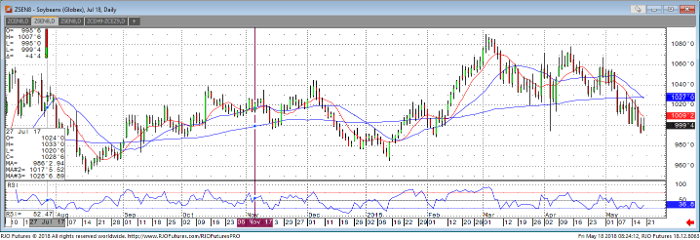
July soybeans continued pushing lower yesterday, trading down to 992^4. The soybean market continues to watch trade negotiations with China closely, as it searches for support. Brazilian currency weakness continues to push the market lower along with producers being active sellers. US soybean exporters announced a sale of 132,000 tonnes this morning, delaying a planned strike at Argentine ports and crushing plants. Momentum studies are approaching oversold levels showing this trend lower may be looking to bounce. The July market shows support at 990^4 and 980^4 with resistance at 1001^2 and 1012^0. The November market sees first support at 1000^4 with resistance coming in at 1013^4.
Soybeans Jul ’18 Daily Chart

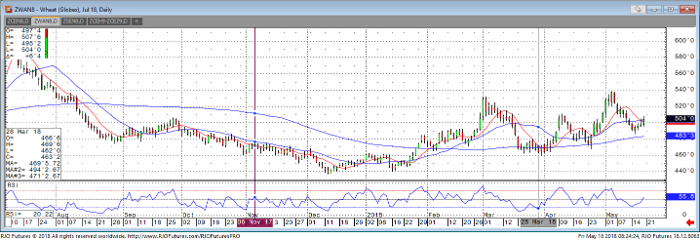
The wheat market has traded higher this week in both the Chicago and Kansas City markets after trading lower off the highs of 538^4 and 568^4 respectively. The market is being pushed higher to start the day mainly by reports of recent storms causing possible wind and hail damage. Dryness issues in Australia, Canada, and Ukraine are also supporting wheat’s push higher. Most areas throughout the US also remain very dry and are in need of rain. Export sales came in today below estimates and wheat sales stand at 95.3% of the USDA forecast. This week’s move higher has turned the trend to the upside. Support in the Chicago market comes in at 491^2 with resistance at 510^4. The Kansas City market sees support at 509^4 and resistance at 536^6.
Wheat Jul ’18 Daily Chart


