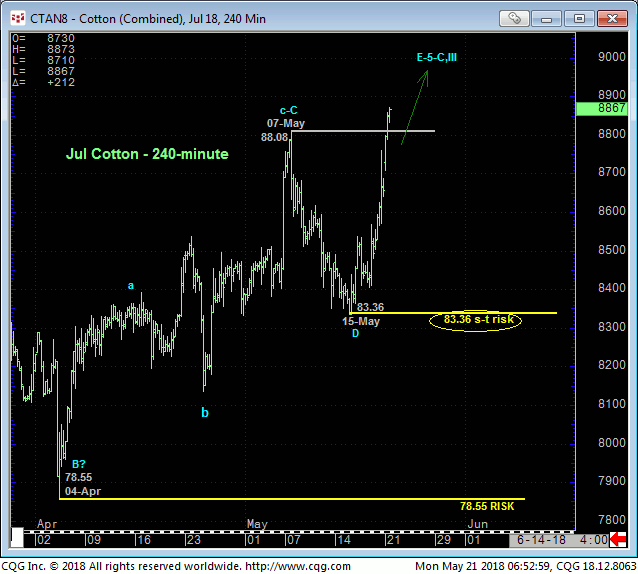
Overnight’s break above 07-May’s 88.08 high in July cotton confirms our suspicions discussed in last Mon’s Technical Blog that the sell-off attempt stemming from that day’s short-term momentum failure below 83.83 was likely corrective within the major 2-year uptrend. As a direct result of this resumed bull the 240-min chart below shows that the market has identified last Tue’s 83.36 low as the latest smaller-degree corrective low and new short-term risk parameter it is now minimally required to fail below to threaten a bullish count and expose even an intermediate-term correction, let alone a broader peak/reversal.

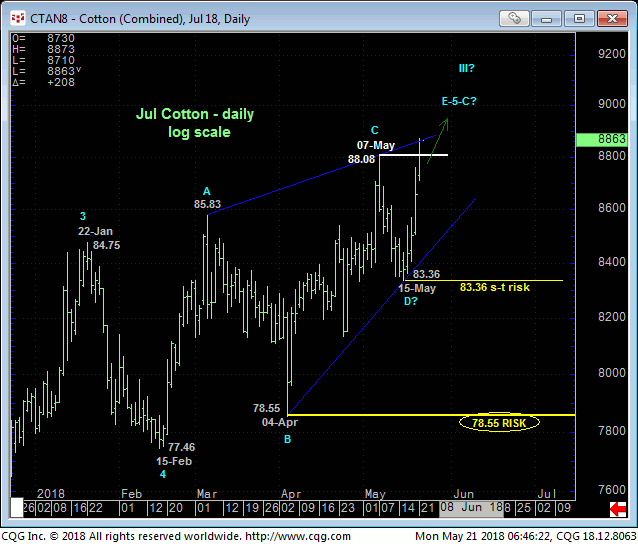
For what it’s worth, we’ve labeled the prospect for a 5th-Wave diagonal triangle up from 15-Feb’s 77.46 low in the daily log scale chart below. To this point the “rising-wedge/diagonal triangle pattern looks rather obvious. We would warn traders however that our experience with such patterns is that they typically mean one of two things:
- waning upside momentum that results in a peak/reversal environment (consistent with the 5th-Wave reference) or
- a sort of “coiling-up” before the uptrend continues in a much more accelerated, ballistic way.
Herein lies the importance of identifying a corrective low and risk parameter like 83.36 from which still-advised bullish policy and exposure can be objectively rebased and managed.

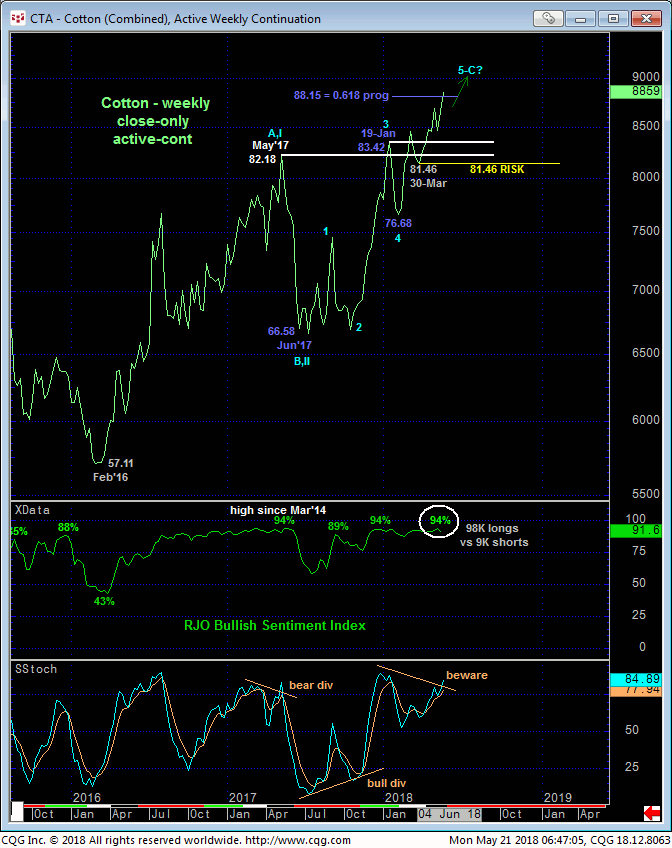
From an even longer-term perspective, late-Apr’s resumption of the 2-year bull trend is clear on a weekly close-only active-continuation chart basis below with now-former 82-to-83-handle-area resistance considered key new support within a major bullish count. A weekly close below 30-Mar’s 81.46 corrective low close (and below all that former resistance-turned-support) is minimally required to threaten the secular bull trend. On an intra-day basis the daily chart above shows this level to be 04-Apr’s 78.55 larger-degree corrective low. These levels serve as our long-term risk parameters to a bullish call and policy.
The weekly chart below also shows bullish sentiment still at historically frothy levels typical of major PEAK/reversal-threat conditions. Traders are reminded however that market sentiment/contrary indicators are not applicable technical tools in the absence of an accompanying bearish divergence in momentum of a scale sufficient to buck the major trend. Per such further and possibly accelerated gains should not surprise.

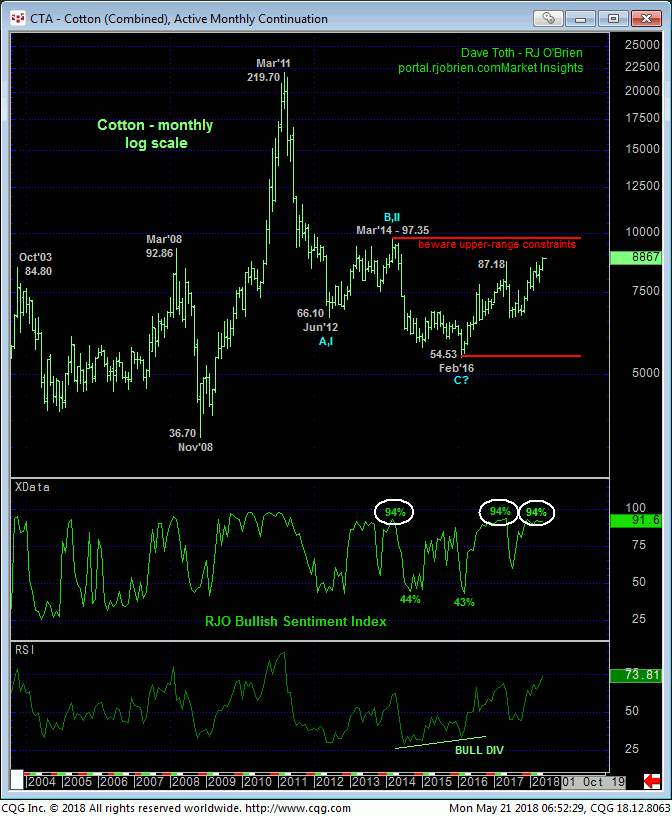
While the trend is up on all scales and should not surprise by its continuance, it’s not hard to find reasons to be watchful for signs of fatigue that could evolve into a major peak/reversal-threat environment. In addition to market sentiment and the prospect that the market is completing a 5-wave Elliott sequence from Jun’17’s low as labeled above, the monthly log active-continuation chart below shows the market’s encroachment on the extreme upper recesses of the past SIX YEARS’ range that could present a slipper slope for bulls. Here again lies the importance of identifying recent corrective low and risk parameters to a still-advised bullish policy. Indeed, until the market proves weakness below levels like 81.46 or even 83.36, there’s no way to know the market isn’t poised for what would be a significant, multi-year reversal of 2011 – 2016’sd entire 3-wave decline from 219 to 54.53 with a breakout above Mar’14’s key 97.35 high.
These issues considered, a bullish policy remains advised for long-term players with a failure below 83.36 required to pare this exposure to more conservative levels and commensurately larger-degree weakness below 81.46 required to jettison the bullish policy altogether. Shorter-term traders whipsawed out of bullish exposure on last week’s mo failure below 83.83 are advised to return to a bullish policy, but to do so following a smaller-degree correction to the past couple days’ spike where the risk/reward merits of doing so would be preferred to “chasing” the bull up here. Given the rising-wedge behavior of the past few months as well as today’s gap-up open, a volatile relapse back to the 86-handle-area or lower would hardly come as a surprise.


