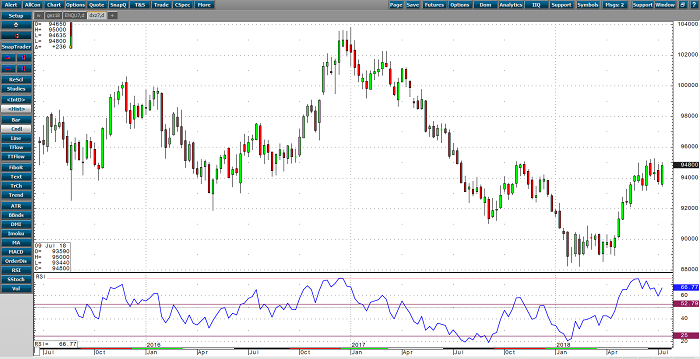
The US Dollar remains bid against all major foreign currencies, pushing to 95.00 overnight and + 1.4% on the week. President Trump announced another round of tariffs directed at $200B worth of Chinese products this week, sending a message to the rest of world that the US will not back down in it’s fight to reshape the global trade parameters. In light of the US/China trade war, the Chinese have been proactive in devaluing the Yuan vs the USD which is a clear sign that the Chinese will continue to attempt to keep the upper hand in global trade.
Further contributing to the strength of the US Dollar was a nearly 7 year high in the y/y Producer Price Index reading, and what seems to be a widening divergence between the US economic picture vs. the rest of the world. Which brings us to the outlook for Federal Reserve monetary policy. The Fed remains adamant about raising interest rates, and quite frankly, should be based on the recent growth and inflation data. However, one cannot help but take notice in the flattening of the 2- and 10-yield spread which has been a harbinger for an oncoming recession for the past 50+ years. In the simplest terms possible, the yield curve indicates that the Federals Reserve’s monetary policy may be too “hawkish” too late in the growth/expansion cycle. The short end of the curve (2-yr yields), is most sensitive to near-term monetary policy, while the long end of the curve (10-yr yields) adjusts to a longer term outlook of the growth cycle and how monetary policy will likely change. While the FOMC remains hawkish on interest rates and the economy, this has kept the 2-yr yields buoyant, while the 10-yr yields have been steadily in decline (at a faster pace than 2-yr yields) since the YTD of 3.13%, which ultimately creates a flattening curve. So the essential question here is whether or not the FOMC is once again behind on it’s economic outlook. We think so. As long as the FOMC remains hawkish on monetary policy, the USD should remain in control vs all of the major foreign currencies around the globe. Recommendation: Manage the Sep USD trading range of 93.60 – 95.25 with a bullish bias.
US Dollar Weekly Continuation Chart


