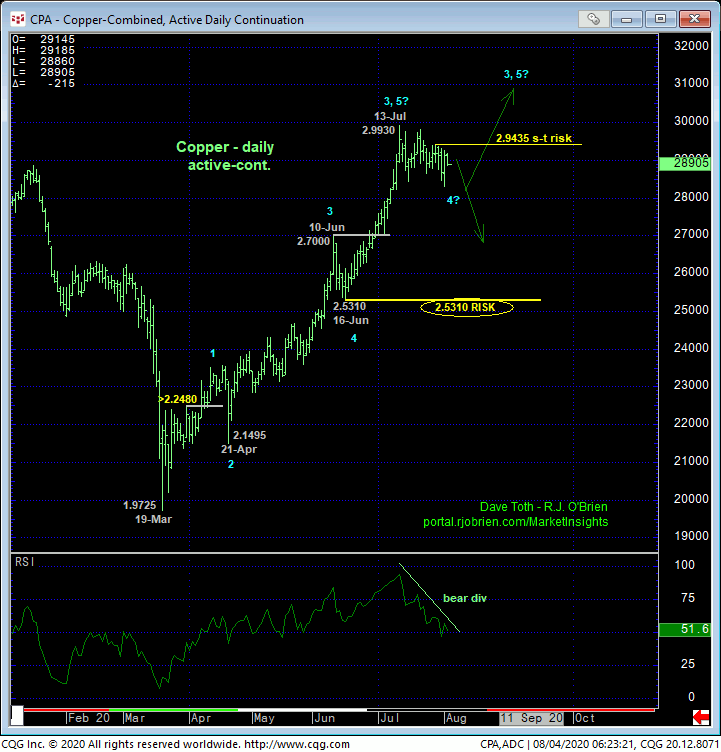
Fri’s break, temporary or not, below 16-Jul’s 2.8450 low and our short-term risk parameter confirms a bearish divergence in short-term momentum discussed in 20-Jul’s Technical Blog that threatens the broader bull trend with at least an intermediate-term correction and possibly a more protracted reversal lower. The 240-min chart above shows that this weakness leaves 29-Jul’s 2.9435 high in its wake as the latest smaller-degree corrective high the market is now required to sustain losses below to maintain a more immediate bearish count. Its failure to do so will render the sell-off attempt from 13-Jul’s 2.9930 high a 3-wave and thus (4th-Wave) corrective affair that would then re-expose the broader bull trend from 19-Mar’s 1.9725 low shown in the daily chart below. Per such, this 2.9435 high is considered our new short-term but key risk parameter from which non-bullish decisions like long-covers and bearish punts can be objectively based and managed.
Given the magnitude of the impressive, impulsive 4-1/2-month uptrend, the past three weeks’ sell-off attempt thus far falls well within the bounds of a mere (4th-Wave) correction within this major uptrend ahead of an eventual (5th-Wave) resumption of the bull to new highs above 2.9930. As a direct result of Fri’s sub-2.8450 slip however, proof of strength above 2.9435 is absolutely required to reinforce this bullish count and re-expose the bull. Until and unless such 2.9435+ strength is shown, the extent of further downside correction or reversal is indeterminable and potentially severe.
From a longer-term perspective, the challenge is identifying a longer-term risk parameter the market is required to fail below to objectively break Mar-Jul’s major uptrend. Arguably and as a direct result of the steep and unrelenting nature Jun-Jul’s portion of the bull, 16-Jun’s 2.5310 corrective low serves as that larger-degree corrective low and key long-term risk parameter the market still needs to fail below to break the impulsive integrity of Mar-Jul’s major uptrend. As conducting non-bullish decisions “down there” seems impractical even to long-term players, longer-term players are advised to acknowledge and accept whipsaw risk above 2.9435 in exchange for much less nominal risk below 2.5310.
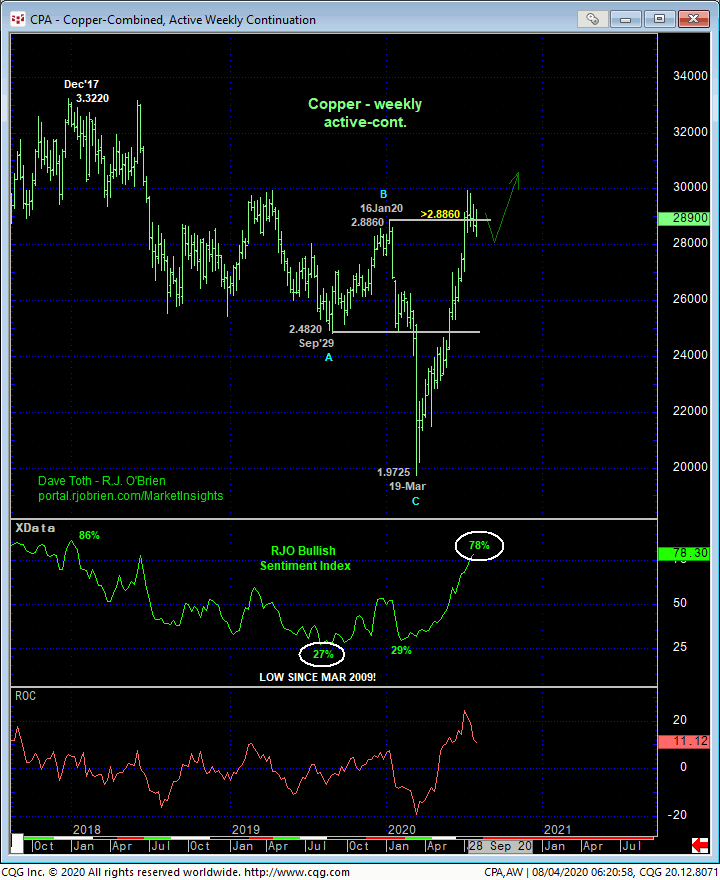
Stepping back even further, it’s hard not to acknowledge Mar-Jul’s reversal as a very impressive one. Starting with the market’s gross failure to sustain Mar’s meltdown spasm below the 2.50-area that supported the market for a year-and-a-half and then recovering above 16-Jan’s 2.8860 major corrective high that, in fact, broke Dec’17 – Mar’20’s major bear trend, this reversal has been an impressive one indeed that easily could have further (5th-Wave) gains ahead depending on its ability to recoup 2.9435. Threats to the bull include:
- the admittedly short-term momentum failure mentioned above
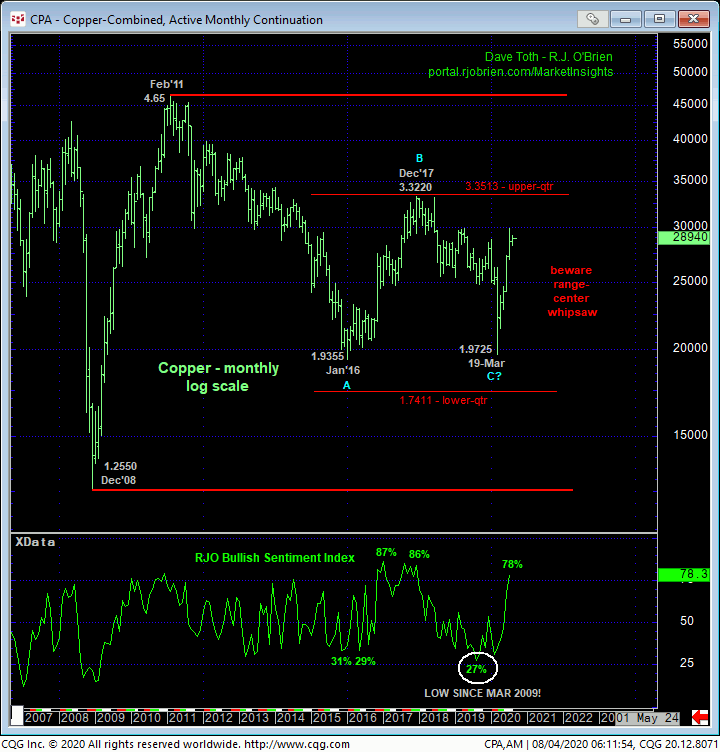
- the market’s position deep within the middle-half bowels of its massive historical lateral range shown in the monthly log chart below where the odds of aimless whipsaw risk are considered higher, and
- the return to frothy bullish levels (78%) in our RJO Bullish Sentiment Index of the hot Managed Money positions reportable to the CFTC.
In sum, we believe these three reasons, along with the impracticality of a longer-term risk parameter down at 2.5310, warrant a move to a neutral-to-cautiously-bearish stance from current 2.8935-area levels with a recovery above 2.9435 negating this specific call and re-exposing the major bull to at least one more round of new highs above 2.9930. In lieu of such 2.9435+ strength, further lateral-to-lower, and possibly much lower prices should not surprise in the period ahead.