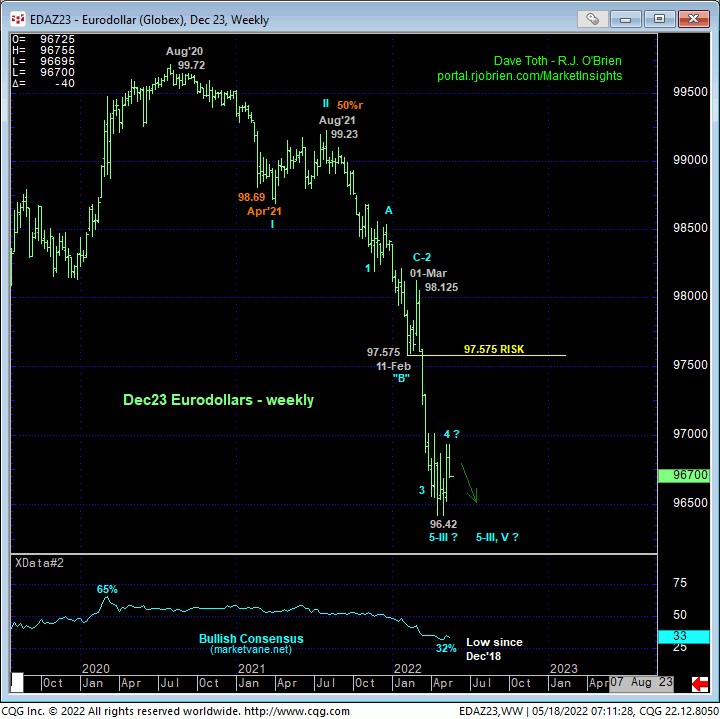
In 25-Apr’s Technical Blog following that day’s bullish divergence in short-term momentum, we discussed the developing prospect for some “non-downside” behavior in the period ahead. Against the backdrop of the secular bear trend shown in the weekly chart above and daily chart below, traders were also advised of the likelihood that any recovery attempt was merely a slightly larger-degree correction within the major bear market. Three weeks on and as we’ll discuss below, yesterday’s countering bearish divergence in short-term momentum may have defined the end or upper boundary to this correction ahead of an eventual resumption of the secular bear trend to new lows below 04-May’s 96.42 low.
While we will discuss the developing importance of Mon’s 96.935 intra-day high as one of developing importance and a mini risk parameter from which non-bullish decisions like long-covers and bearish punts can now be objectively based and managed, the sheer magnitude of the secular bear trend requires commensurately larger-degree proof of strength to negate it. Specifically, a recovery above at least former 97.575 former support-turned-resistance from 11-Feb is required at this point to even defer, let alone threaten the major bear market.
The 240-min chart above and close-only chart below show the market’s recovery attempt following 25-Apr’s bullish divergence in short-term momentum. These charts also show yesterday’s bearish divergence in short-term mo below Fri’s minor corrective lows that define Mon’s 96.935 intra-day high and 96.915 high close as the end of the rally attempt from 04-May’s lows (although we’re using Thur’s 96.92 high close as the mini bear risk parameter). Especially on the close-only basis below, the recovery from 22-Apr’s 96.44 low looks to be about as textbook a 3-wave Elliott structure as there is. Left unaltered by a recovery above 96.92 on a closing basis or above 96.935 on an intra-day basis, this 3-wave recovery is considered a corrective/consolidative event that warns of a resumption of the secular bear trend that preceded it.
This said, while 04-May’s 96.42 low and support remains intact, this level remains as a short-term risk parameter from which traders can still objectively base and manage non-bearish decisions like short-covers and bullish punts. In effect, we believe the market has identified 96.42 and 96.935 as the key flexion points heading forward around which directional biases and exposure can be objectively based and managed. Traders are advised to return to a bearish policy and exposure with a recovery above 96.935 required to negate this specific call and warrant its cover. In lieu of such strength, further and possibly accelerated losses should not surprise, including a resumption of the secular bear market below 96.42.