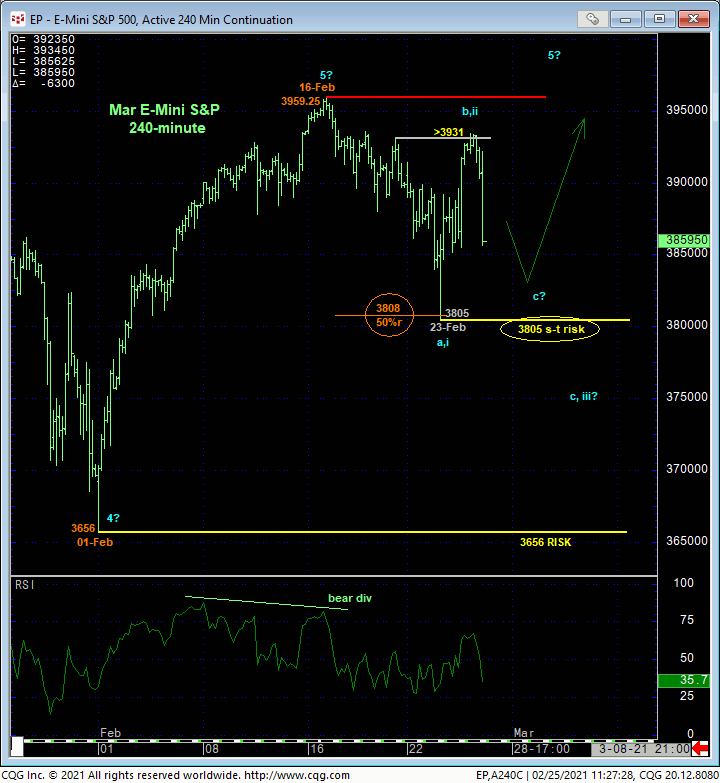
In Mon’s Technical Blog we identified a minor corrective high from last Fri’s at 3931 that we believed the market needed to recover above to arrest the developing relapse following that day’s bearish divergence in short-term momentum below 3878. The 240-min chart below shows yesterday’s recovery above this 3931 threshold that defines Tue’s 3805 low and 50% retrace of Feb’s 3656 – 3959 rally as one of developing importance and a short-term but critical level we believe this market needs to sustain gains above to maintain the ultimately bullish count that contends the past week-and-a-half’s sell-off attempt is another relatively minor correction within the secular bull trend. Per such, we’re identifying Tue’s 3805 low as our new short-term but pivotal risk parameter from which shorter-term traders can objectively rebase and manage the risk of non-bearish decisions like short-covers and cautious bullish punts.
A failure below 3805 would still be of too minor a scale to conclude anything more than a prospective correction within the secular bull, but there are NO LEVELS of any technical merit between 3805 and 01-Feb’s larger-degree corrective low and key longer-term risk parameter at 3656. So if you’re of a risk profile that doesn’t allow risking a long S&P position to 3656, your ONLY recourse is to neutralize exposure on a failure below 3805.


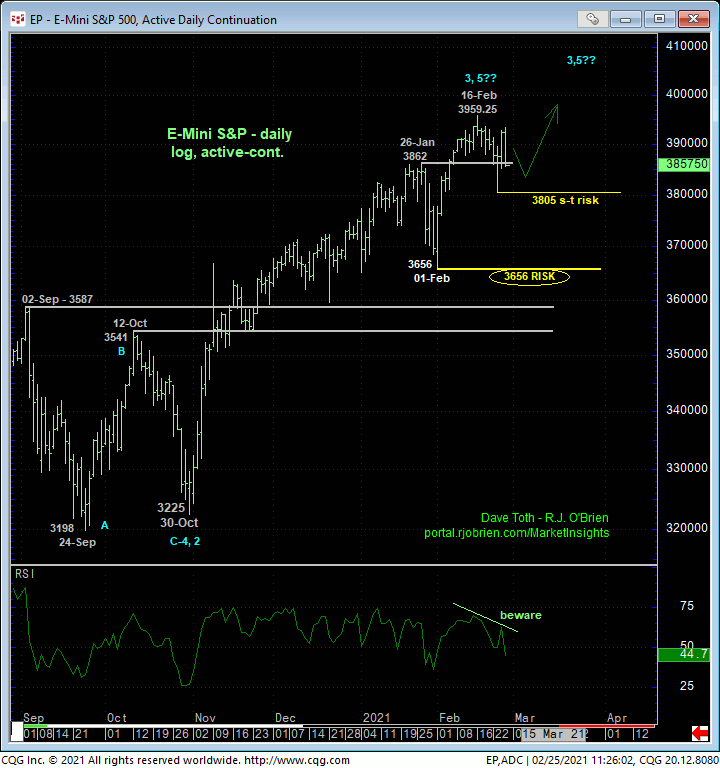
From a longer-term perspective, it’s easy to see the rationale that 01-Feb’s 3656 larger-degree corrective low is THE KEY risk parameter the market is still required to fail below to, in fact, confirm a bearish divergence in momentum of a scale sufficient to break the uptrend from 30Oct20’s 3225 low and perhaps even threaten the secular bull trend. A short-term failure below 3805 cannot be ignored as grease for the larger-degree failure wheels.
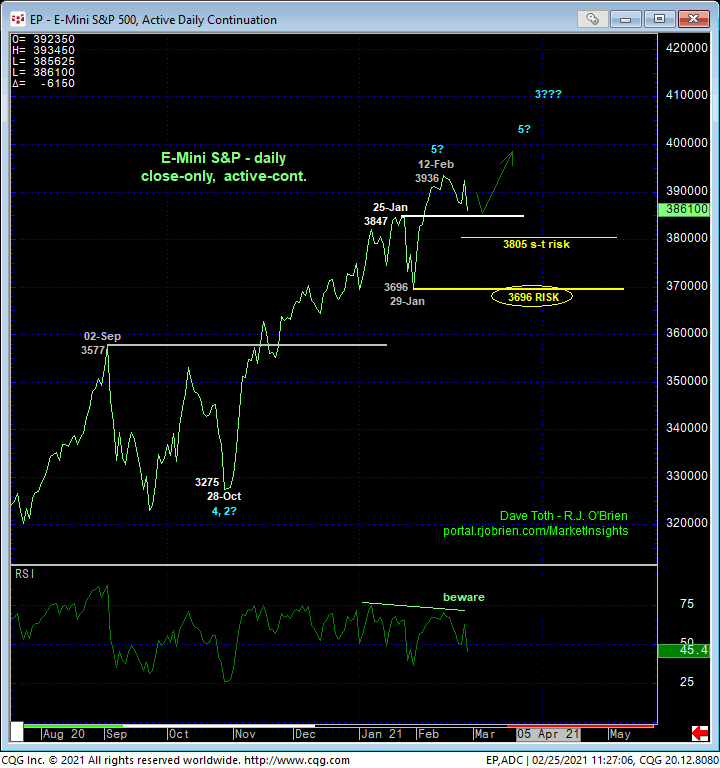
Reinforcing the importance of 3805 as an interim bull risk parameter is the 3847-area of former resistance-turned-support shown in the daily close-only perspective shown below. If the risk/reward merits of a bullish policy and exposure are to remain intact, this former resistance-area around 3847 would be expected to hold, and certainly Tue’s 3805 low should. A break below 3805 would render that low an initial A- or 1st-Wave of a larger-degree correction or possibly a protracted reversal lower where the market’s downside potential would be indeterminable and potentially extreme. And again, from a longer-term perspective, the next and only) objective flexion point below 3805 is 01-Feb’s 3656 low. What the market has in store for us between 3805 and 3656 is anyone’s guess. As such guesswork is outside the bonds of technical discipline, traders and investors are advised to make directional decisions around 3805 and/or 3656.

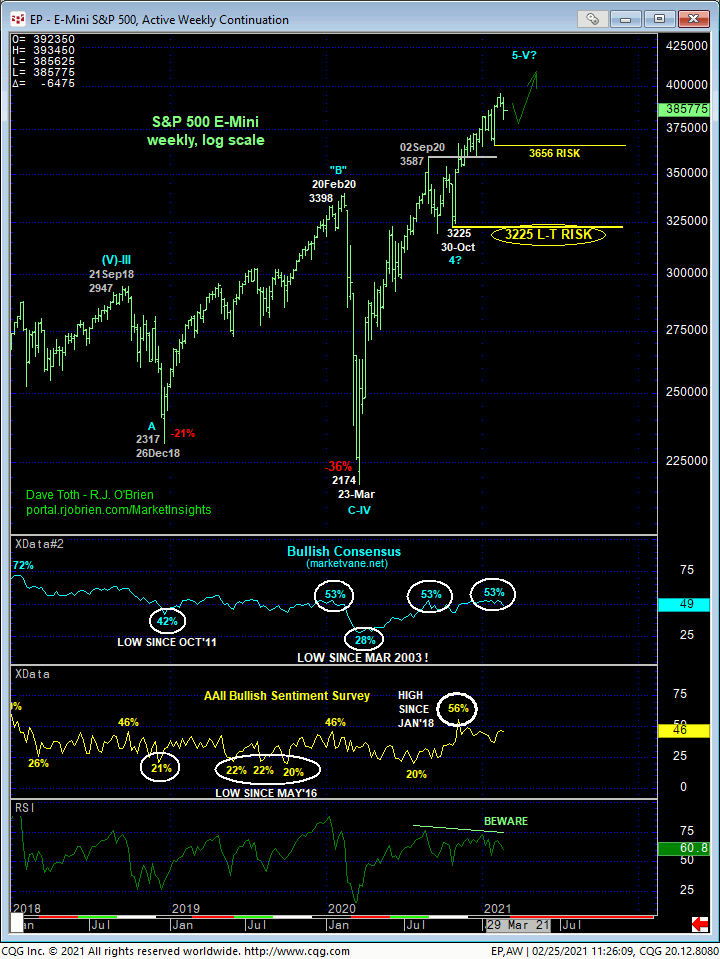
Finally, the weekly log scale chart puts that 3656 larger-degree corrective low and key long-term risk parameter into perspective. CLEARLY, this is the level this market is minimally required to break to break the uptrend from even last ct’s 3225 low, let alone threaten the secular bull.
These issues considered, a bullish policy remains advised for long-term players and investors with a failure below 3805 required to pare exposure to more conservative levels and commensurately larger-degree weakness below 3656 to jettison remaining exposure altogether. Shorter-term gtraders with tighter risk profiles are advised to maintain a neutral/sideline policy for the time being and be watchful for a relapse-stemming bullish divergence in short-term mo (hopefully above 3805) to arrest the past week-and-a-half’s sell-off attempt and provide a more reliable low and support from which a resumed bullish punt can then be objectively based and managed. A break below 3805 opens up some potentially big problems and threats and would certainly qualify recent highs and resistance as new crucial (bear) risk parameters the market would then be required to recoup to resurrect the bull.


