Posted on Mar 27, 2023, 07:37 by Dave Toth
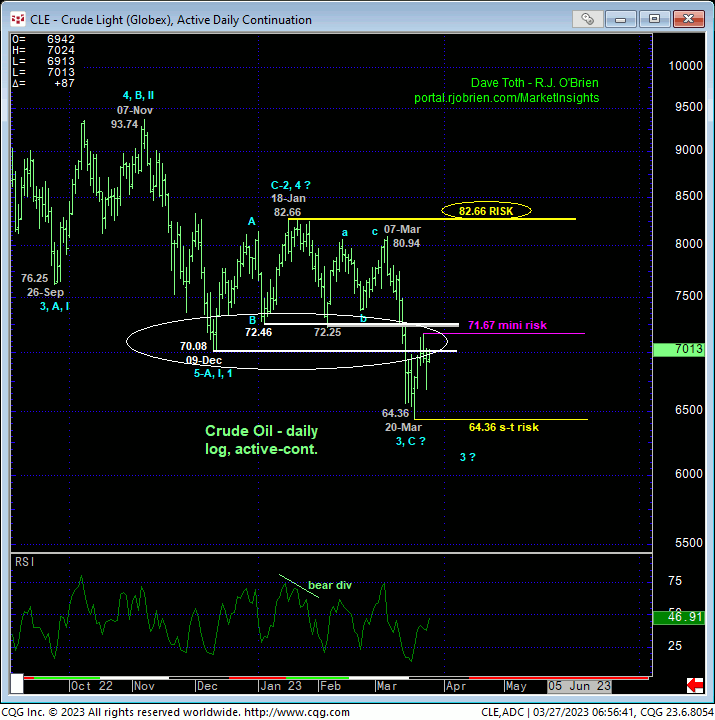
In 17Jun22’s Technical Webcast we introduced the prospect for major peak/reversal threats across the entire energy complex. Nine months on and after a 48% decline, some technical elements are developing that warn that a more protracted rebuttal to this major swoon may be near. In 21-Mar’s Technical Blog following the prior week’s breakdown below the past QUARTER’S support around the 70.08-to-72.46-area shown in the daily log chart below, we identified this now-former support as a key new resistance area. Per any broader bearish count, we’d expect any interim correction to be stifled by this 70.08-to-72.46-area.
A recovery above 72.46 won’t necessarily allow us to conclude a larger-degree base/correction/recovery count as commensurately larger-degree strength above 18-Jan’s 82.66 larger-degree corrective high remains required to, in fact, break the 9-month downtrend. For ancillary reasons we’ll discuss below however, we believe a recovery above the 72.46-area in general and above last week’s 71.67 high specifically will threaten the risk/reward merits of a continued bearish policy enough to warrant flipping the script on a longer-term bearish count and moving to at least a neutral/sideline stance, if not a cautious bullish policy.

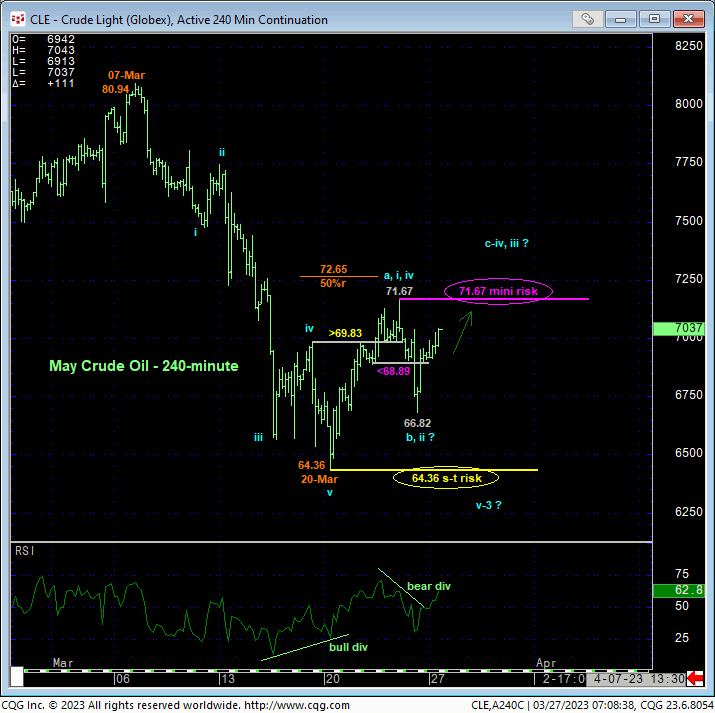
Drilling down to an intra-day scale and as discussed in 22-Mar’s Technical Webcast, that day’s recovery above 17-Mar’s 69.83 smaller-degree corrective high confirmed a bullish divergence in short-term momentum that defined 20-Mar’s 64.36 low as the end of a nice-looking 5-wave Elliott sequence down from 07-Mar’s 80.94 high. Fri’s slip below an even smaller-degree corrective low at 68.89 confirmed a countering bearish divergence in short-term momentum that left last week’s 71.67 high in its wake as a mini risk parameter from which short-term traders with tighter risk profiles can objectively base non-bullish decisions like long-covers and cautious bearish punts. A recovery above 71.67 will nullify this bear divergence and resurrect at least an intermediate-term uptrend and further correction of at least Mar’s portion of the bear. And as of this morning’s pricing, the market looks like it may have survived a (B- or 2nd-Wave) corrective retest of 20-Mar’s 64.36 low. Against this backdrop and because of some developing longer-term base/reversal elements, we believe relatively short-term strength above 71.67 could lead to more protracted, even surprising gains thereafter.

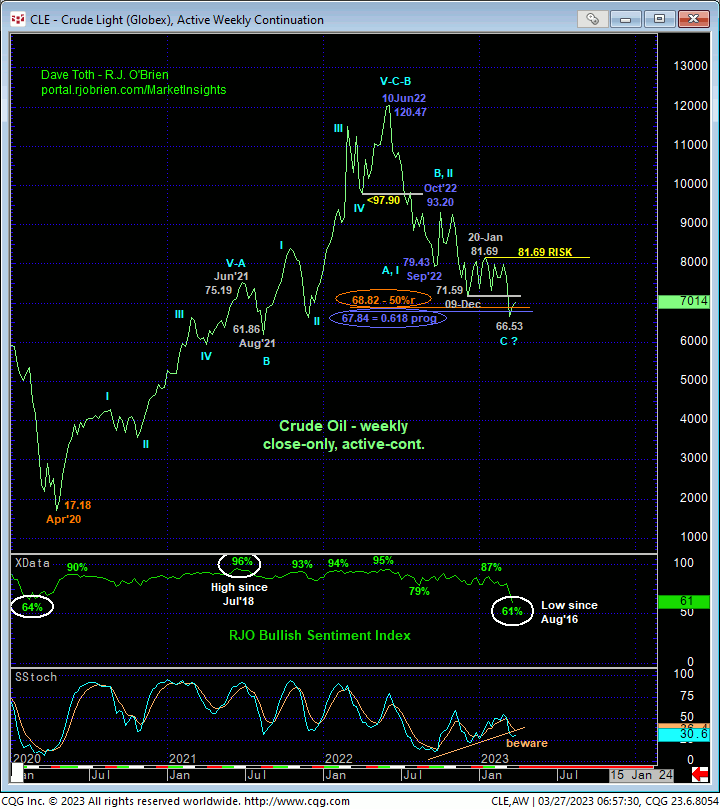
Stepping back to a longer-term weekly close-only cart below, in recent updates we’ve discussed the important combination of waning downside momentum around an interesting pair of Fibonacci retracement and progression relationships at 68.82 and 67.84, respectively. These mean little and are unreliable in the absence of an accompanying confirmed bullish divergence in momentum needed to, in fact, break the broader downtrend. Herein lies the importance of mid-Jan’s larger-degree corrective high we identified at 82.66 on an intra-day basis and 81.69 on the weekly close0-only basis below. “Interim” strength above last week’s 71.67 high will be a step in that direction, although “more proof” of strength above the entire resistance area around 72.46 would be another strength step.
What contributes, perhaps mightily, to this base/correction/reversal count is the latest update from Fri in our RJO Bullish Sentiment Index of the how Managed Money positions reportable to the CFTC. In the chart below, this Index has dropped to 61%, its lowest level since Aug 2016. Alone, this indicator means little. COMBINED with strength above at least 71.67 and then subsequently above 72.46, the extent to which this market might have now become vulnerable to HIGHER prices should not be underestimated.

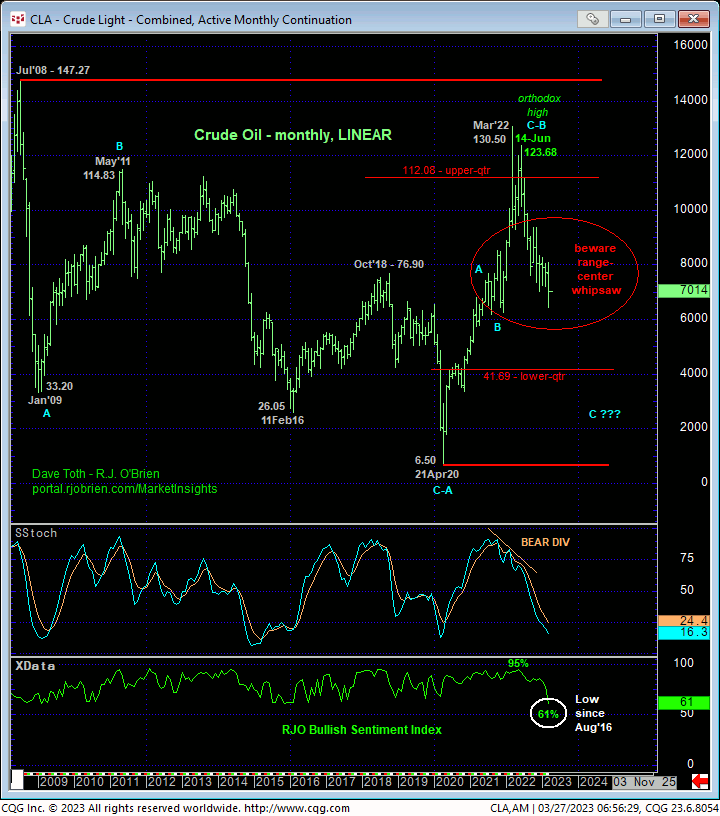
Lastly and on an even broader monthly scale, the chart below shows the market’s position deep, deep within the middle-half bowels of its massive but lateral historical range, where the odds of aimless whipsaw risk are approached as higher, warranting a more conservative approach to risk assumption. Herein lies the importance of identifying tighter but objective directional flexion points and risk parameters like 71.67, the 72.50-area and 64.36.
These issues considered, a bearish policy remains advised for longer-term commercial players with a recovery above 72.50 required to defer or threaten this call enough to warrant moving to a neutral/sideline position. Shorter-term traders with tighter risk profiles have been advised that they can play either direction with 71.67 and 64.36 being the specific and key levels around which to toggle biases and exposure. But as a result of the factors discussed above, especially our RJO BSI, emphasis is placed on moving to or maintaining a bullish stance if the market recoups last week’s 71.67 high. The market’s upside potential above that point could be surprising, including a run at or even above mid-Jan’s key 82.66 high.


