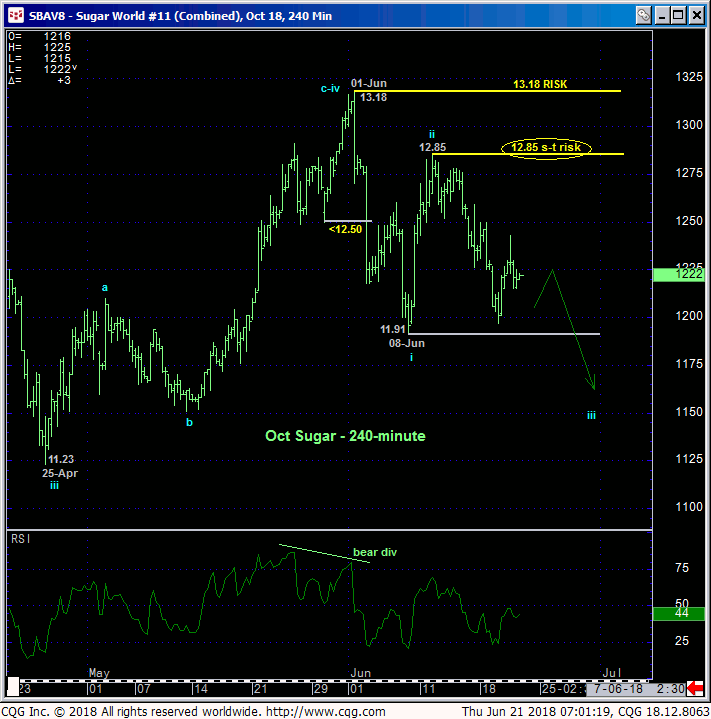
Wow, with the market back to hanging around some of its lowest prices in the past 10 years, the case for another halving of prices over the next two or three years might seem absurd. But we’ll discuss some of the building blocks for such a longer-term case further down. First, we’d like to discuss the growing prospect that the recovery attempt from 25-Apr’s 11.23 low in the now-prompt Oct contract to 01-Jun’s 13.18 high is a 3-wave and thus corrective affair consistent with the current broader downtrend from 03-Jan’s 15.43 high as labeled in the 240-min chart below.
Following 04-Jun’s bearish divergence in momentum that identified 01-Jun’s 13.18 as relevant, the extent of this week’s relapse shows that the market survived a corrective retest-of-the-high attempt that leaves 12-Jun’s 12.85 high in its wake as a short-term risk parameter this market is now minimally required to recoup to threaten a more immediate bearish count. No, the market has not yet broken 08-Jun’s 11.91 initial counter-trend low needed to CONFIRM this shorter-term bearish count, but against the volume of bearish work on longer-term scales we believe the odds are in favor of continuing to err on the side of the bear.
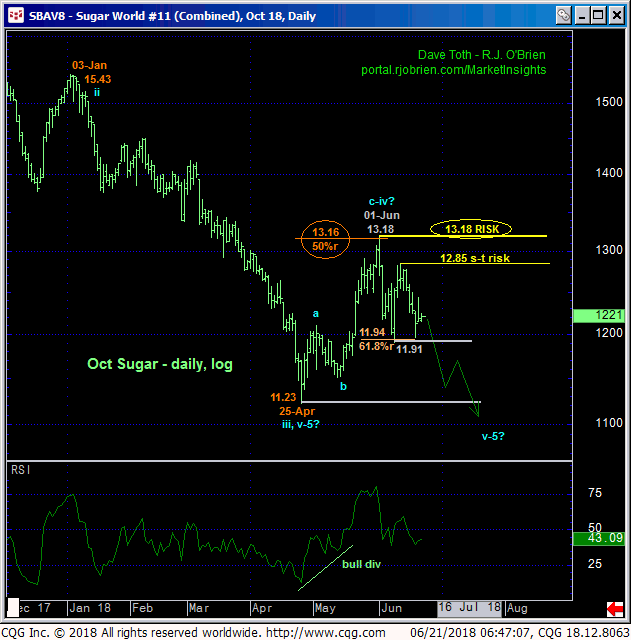
An interim challenge to ANY count really is the market’s position back in the middle of the past couple months’ 11.23 – 13.18-range where the odds of aimless whipsaw risk are always approached as higher. But until threatened by strength above at least 12.85 or negated by a recovery above 13.18, Apr-Jun’s 3-wave, 50% retracement of Jan-Apr’s 15.43 – 11.23 looks to be a textbook example of a corrective/consolidative event that warns of a resumption of that downtrend that preceded it. There’s no telling how long this market could waft around within this range before the bear resumes, but for these reasons cited thus far, let alone some massive bearish stuff get to below, we believe the better bet is that this market will see sub-11.23 levels before 13.18+ levels.
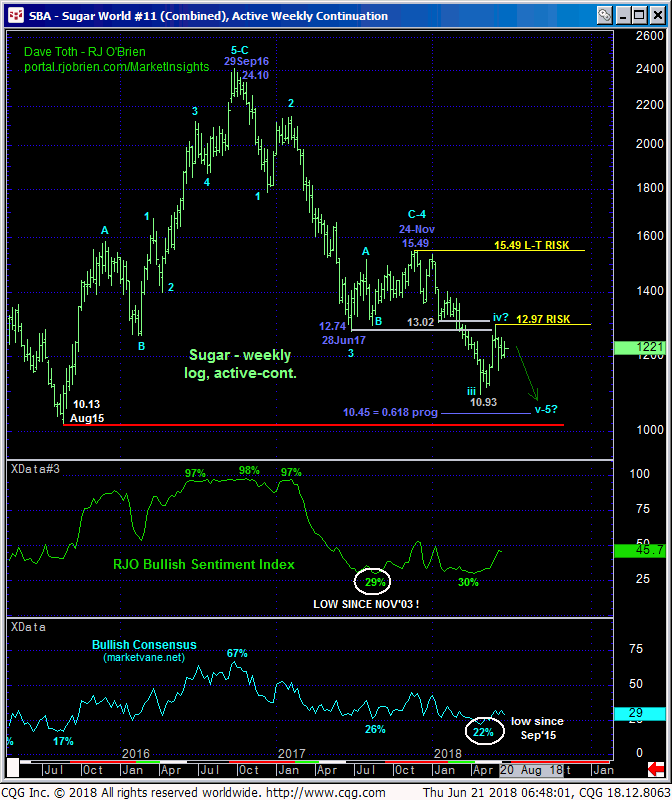
On the next larger scale, the weekly log active-continuation chart below shows the market’s proximity to the extreme lower recesses of the past three years’ range amidst understandably historically bearish sentiment levels. This combination presents a slippery slope for bears. This said, early-Mar’s break below the prior NINE MONTHS’ support around the 12.75-to-13.00-area leaves this range intact as a key new resistance candidate. Early-Jun’s rejection of this area reinforces this fact and highlights 01-Jun’s 13.18 high as a relatively tight but absolutely pivotal threshold and parameter from which the risk of a long-term bearish policy and exposure can be objectively based and managed.
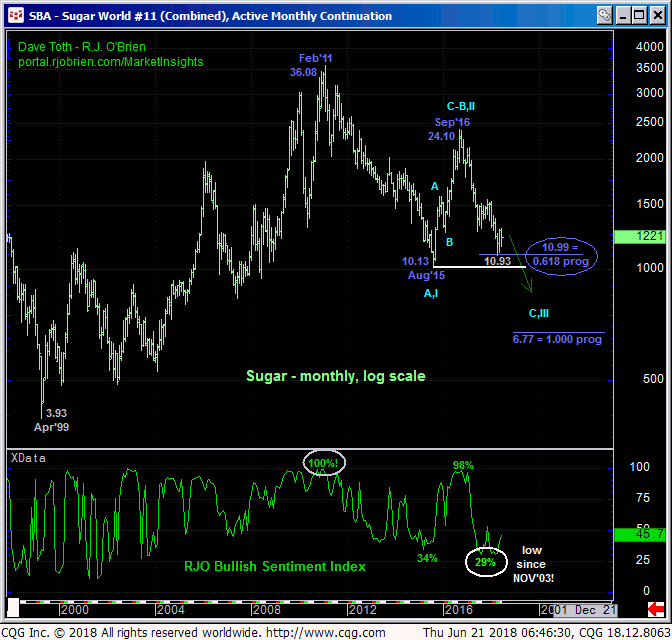
Moving farther out, it is very interesting to note that the decline from Sep’16’s 24.10 high came within a mere six ticks of its (10.99) 0.618 progression of 2011 – 2015’s preceding 36.08 – 10.13 decline on a monthly log scale basis below. 25-Apr’s low in the then-prompt Jul contract was 10.93! And just ahead of Aug’15’s obviously important 10.13 low and support, it’s not hard to fathom why we’ve seen some “non-downtrending behavior” recent.
As there are only three types of markets- trending, consolidation within a trend, or reversal- it is our current challenge to discern whether the recovery attempt from 11.23 to 13.18 is a consolidation or a reversal. As stated above, until the market breaks above at least 12.85 and preferably 13.18, we believe the odds favor a consolidation ahead of new lows below 11.23 and then 10.93.
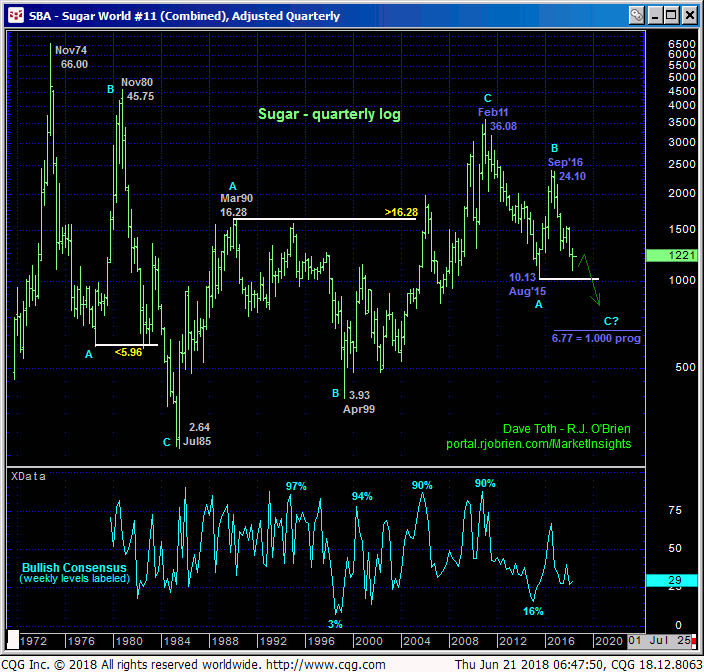
But from a very long-term perspective shown below, there’s also the label that needs to describe the Aug’15 – Sep’16 recovery from 10.13 to 24.10. Given the extent and impulsiveness of the past 21-month decline, it’s not hard to make the case that the 2015-16 rebound was a correction within a new secular bear market from Feb’11’s 36.08 high that warns of a break below Aug’15’s 10.13 low. And since the (10.99) 0.618 progression of 2011-15’s 36.08 – 10.13 decline from Sep’16’s 24.10 high has held so well, it’s not a stretch to look at the next (1.000) Fibonacci progression of the 2011-15 decline that cuts across at 6.77.
Applying this 1.00 progression from a TIME perspective, a repeat of 2011-15’s 54-month downtrend from Sep’16’s 24.10 high projects to the Feb 2020 period. As we’re nearly two years into this prospective bear, this count suggests a move to the 6.77-area over the next 20 months or so.
Wow!
However, if we take an even bigger step back to consider the past 44-year history of this market shown in the quarterly log scale chart below, we see two massive, 3-wave moves where the INITIAL counter-trend move was eventually followed by a resumption of that trend.
The 1974 – 1978 collapse from 66.00 to 5.96 was eventually followed by the collapse from 1980’s 45.75 high to 1985’s 2.64 low. 1985 – 1990’s 2.64 – 16.28 rally was eventually followed by the 1999 – 2011 resumed bull from 3.93 to 36.08. Against this historical backdrop and given the technical facts stated above, it’s not hard to consider the 2011 – 2015 decline as another INITIAL counter-trend move that, after surviving a steep but corrective 2016 rebound, may be poised to resume in a big way below Aug’15’s 10.13 low. And once below 10.13, the market will have exposed a vast chasm with NO SUPPORT.
At that point there would only be unreliable “derived” levels (like Fib progressions) to speculate on an extent of the bear. One of those speculative levels would be the (6.77) 1.000 progression of the 2011-15 decline from the Sep’16 high. As massive a move as this sounds however, within the bounds of this market’s 44-year history such a move does not look outlandish at all. Indeed, it’s easily seen as another gyration within the MIDDLE-HALF bowels of the historical range.
In sum, a bearish policy remains advised with a recovery above 12.85 minimally required for shorter-term traders to step aside and subsequent strength above 13.18 for long-term players to take similar defensive action. In lieu of such strength and while acknowledging the prospect for further intra-2-month-range chop, we anticipate an eventual resumption of the longer-term bear trend to new lows below 11.23 and eventually 10.93 that we believe could open the floodgates to indeterminable losses thereafter, including a run at the 6.75-area over the course of the next 20 months.
