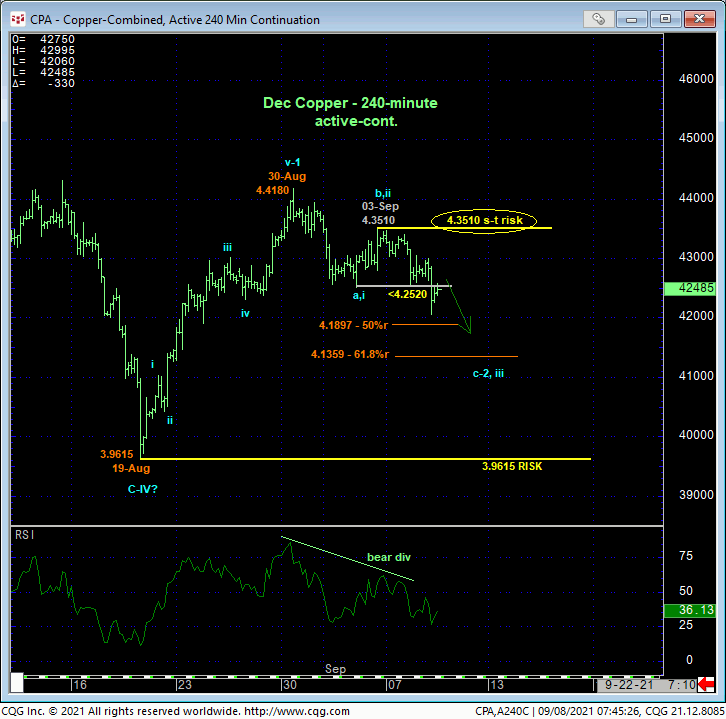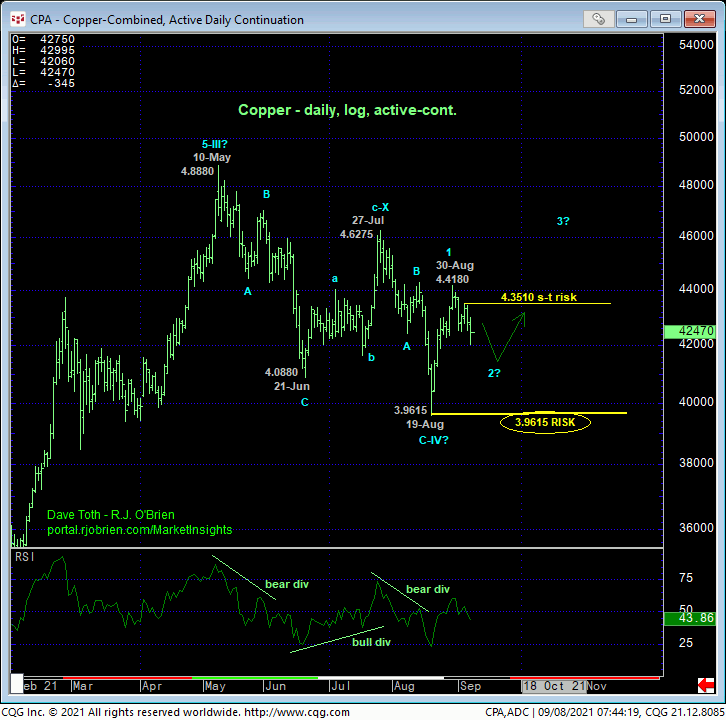
Since early-Jun, we’ve been approaching this market from a major peak/reversal-threat perspective following a bearish divergence in momentum amidst historically frothy bullish sentiment and an arguably complete 5-wave Elliott sequence up from Mar’20’s 1.9725 low. But while overnight’s failure below 02-Sep’s 4.2520 initial counter-trend low confirms a bearish divergence in short-term momentum, the extent and especially the 5-wave impulsiveness of the rally from 19-Aug’s 3.9615 low to 30-Aug’s 4.4180 high cannot be ignored as a prospective 1st-Wave of a resumption of the secular bull trend. We detail additional bullish factors below, but suffice it here to say that this market needs to break 19-Aug’s 3.9615 low and new long-term bull risk parameter to negate a resumed bullish count and resurrect a broader peak/reversal count.
From a short-term perspective, today’s resumed slide below 4.2520 leaves last Fri’s 4.3510 high in its wake as the latest smaller-degree corrective high. This is THE level the market would be expected to sustain trendy, impulsive losses below IF it’s got something bigger to the bear side in mind. Its failure to do so will render the relapse attempt from 30-Aug’s 4.4180 high a 3-wave and thus corrective affair and tilt directional scales further to the bull side. In this regard, this 4.3510 level serves as our new short-term risk parameter from which a bearish policy and exposure can be objectively based and managed.


From a longer-term perspective, the threat to a major peak/reversal count arose from the extent and impulsiveness of the second-half of Aug’s recovery from 3.9615 to 4.4180 shown in the daily log chart above. The bear had EVERRY opportunity to perform in “3rd-wave-down” fashion in mid-Aug when it broke 21-Jun’s 4.0880 low, but it failed miserably to do so, at least thus far. And because of this fact, it’s hard to ignore the prospect that all of the price action down from 10-May’s 4.8880 high isn’t labored, 3-wave corrective as labeled above. To negate this count, all the bear has to do now is sustain trendy, impulsive behavior lower, below 4.3510, and break 3.9615. UNTIL such weakness is proven and especially if the market recoups 4.3510, a resumption of the secular bull trend must be considered.
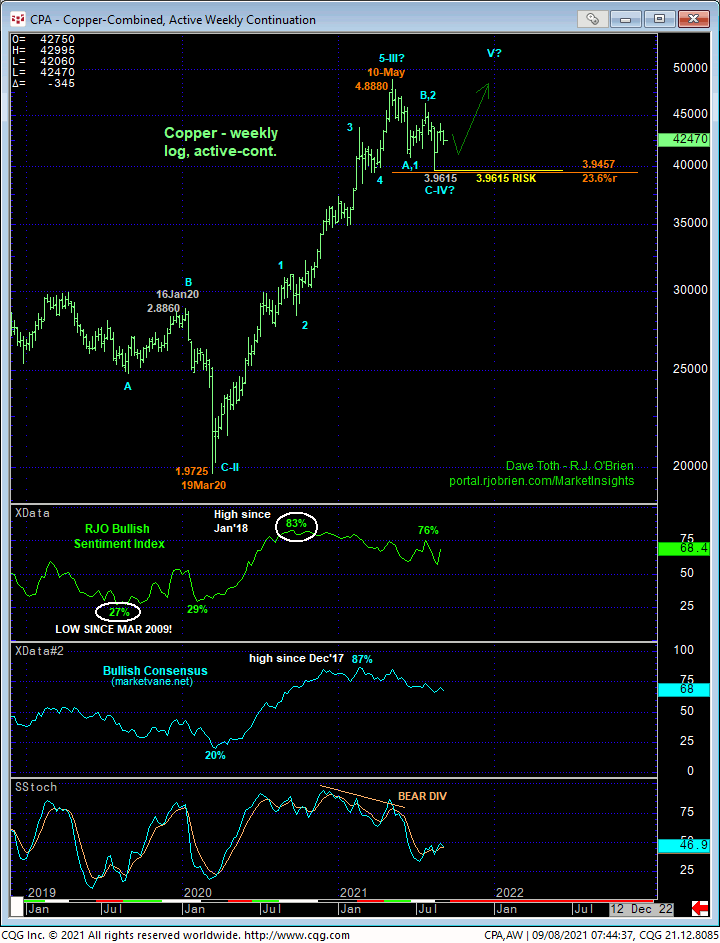
Additionally, on a weekly log scale basis below, the fact that May-Aug’s sell-off attempt stalled in the neighborhood of a Fibonacci minimum 23.6% retrace (3.9457) of Mar’20 – May’21’s 1.9725 – 4.8880 rally- at least thus far- arguably underscores underlying strength.

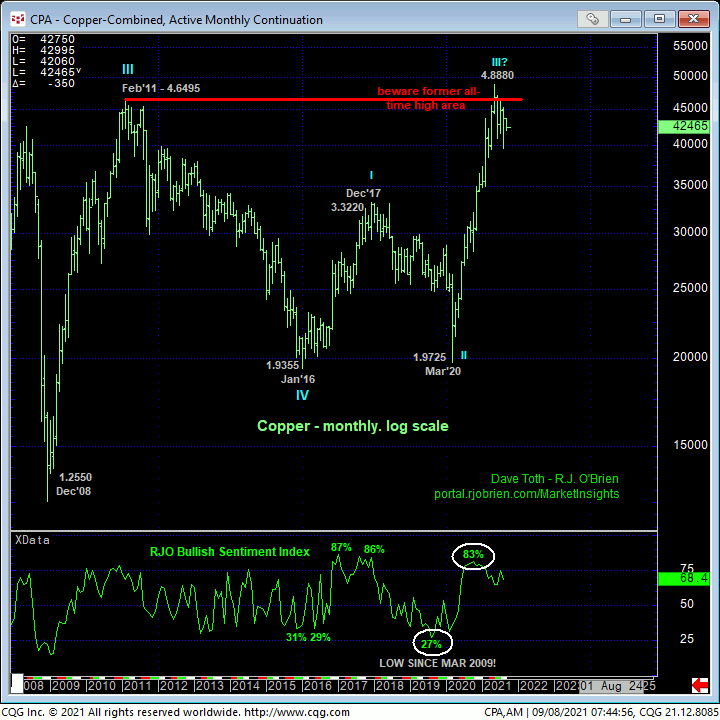
From an even longer-term perspective looking at the monthly log chart below, there remains no question that the market’s recent proximity to and rejection of 2011’s previous all-time high of 4.6495 remains a massive peak/reversal-threat element. And indeed, a relapse below 3.9615 will resurrect such a count. But until such weakness is shown and especially if the market recovers above 4.3510, traders are advised to reconsider the prospect for a resumption of the secular bull trend.
In sum, we believe this market has identified 3.9615 and 4.3510 as the key directional flexion points heading forward. Traders are advised to toggle directional policies and exposure around these levels commensurate with their personal risk profiles.


