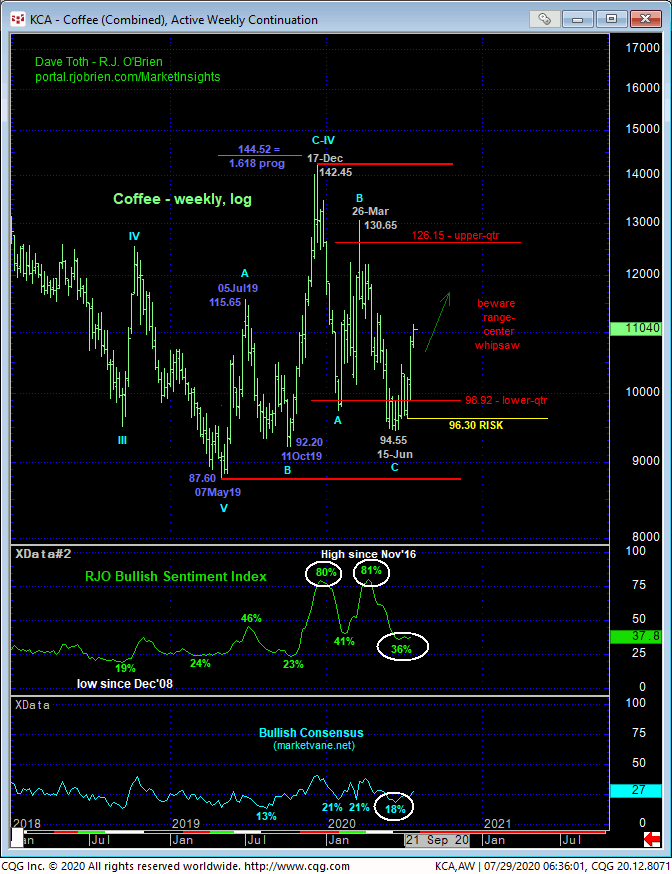
We introduced the technical elements that warned of a base/reversal-threat environment in 24-Jun’s Trading Strategies Blog. Over a full month later, the weekly log scale chart below shows that the market can look back at six weeks of basing behavior that clearly breaks at least Mar-Jun’s downtrend and totally rejected the lower-quarter of a 87.60 – 142.45 lateral range that dates back two years. Despite this clear reversal however, both the Bullish Consensus (marketvane.net) and our proprietary RJO Bullish Sentiment Index of the hot Managed Money positions reportable to the CFTC show that the huddled masses remain on a bearish tack. This still-bearishly-skewed policy into the face of a clear reversal may be considered fuel for upside vulnerability as the overall market forces the eventual capitulation of this short-and-wrong exposure that may only exacerbate the reversal.
We anticipated a return to at least the middle-half bowels of the 2-year lateral range that the market has achieved and where must now acknowledge the increased odds of aimless whipsaw risk typical of such range-center conditions. But given the huddled mass’ bearish stubbornness against this reversal, traders should also be aware of what think are increased odds of steep, accelerated gains straight away.


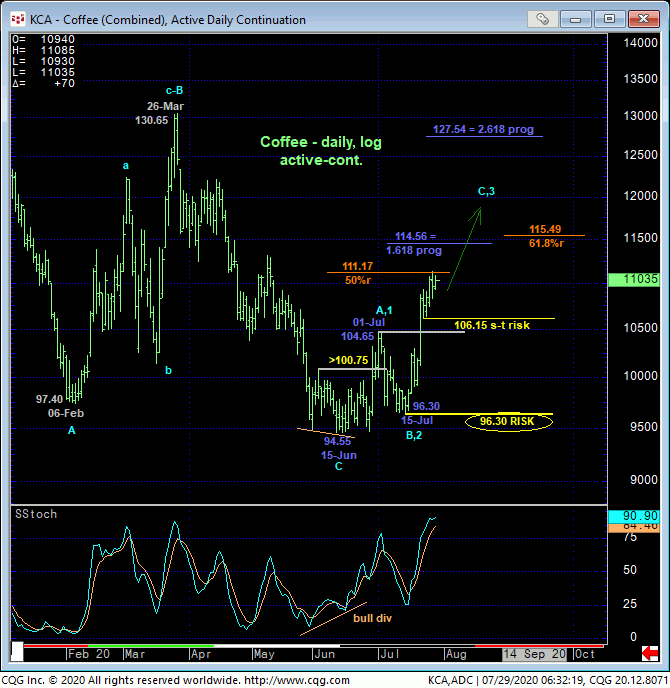
As discussed in 22-Jul’s Technical Blog, the extent and impulsiveness of that day’s break above 01-Jul’s 104.65 high clearly confirmed our base/reversal count and warned of further and possibly steep gains straight away. In the daily log scale chart above we’ve noted a number of Fibonacci retracement and progression relationships ranging from the currently engaged (111.17) 50% retrace of Mar-Jun’s 130.65 – 94.55 decline to the (127.54) 2.618 progression of late-Jun’s initial 94.55 – 104.65 rally from 15-Jul’s 96.30 corrective low. As merely “derived” technical levels, and like all other derived levels (i.e. Bollinger bands, channel lines, imokus, the always-useless moving averages, etc.), in and of themselves these levels are meaningless. We listed them as “levels of interest” around which to keep a keen eye on the only factor that will threaten or derail the clear and present uptrend: a confirmed bearish divergence in momentum.
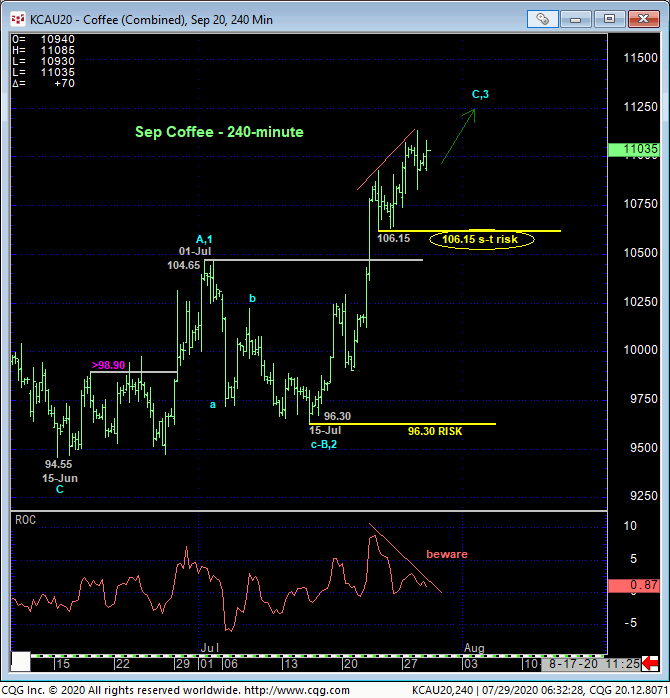
The 240-min chart below shows that by virtue of the past few days’ continuation of the bull, the market has identified 23-Jul’s 106.15 low and 15-Jul’s 96.30 low as the latest smaller- and larger-degree corrective lows the market is now required to fail below to defer/threaten and then negate our bullish count. Per such, these levels represent our new short- and long-term risk parameter from which a recommended bullish policy and exposure can be objectively rebased and managed. IN lieu of such weakness, further and possibly accelerated gains remain expected.
These issues considered, a bullish policy and longs recommended from 98.70 OB remain advised with a failure below 106.15 required for shorter-term traders with tighter risk profiles to take profits and move to the sidelines. Longer-term players are OK to pare bullish exposure to more conservative levels on a failure below 106.15, with commensurately larger-degree weakness below 96.30 required to neutralize remaining exposure altogether. In lieu of weakness below at least 106.15 and preferably 96.30, further and possibly accelerated gains straight away should not surprise.


