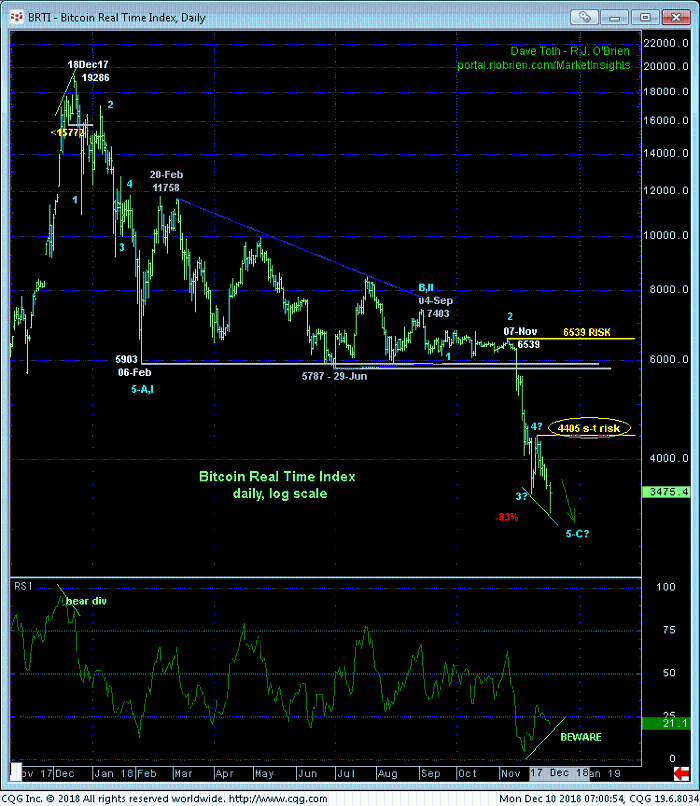
This week marks the 1-year anniversary of the launch of Bitcoin futures on the CME. Our first analysis of this market and phenomenon came on the first day of trading in 2018 with 02-Jan’s Technical Blog where we discussed 20Dec17’s bearish divergence in momentum below 13-Dec’s 15,772 corrective low that marked 18Dec17’s 19,286 high in the underlying index as one of developing importance and the prospective END of the rally ahead of a larger-degree correction or reversal lower.
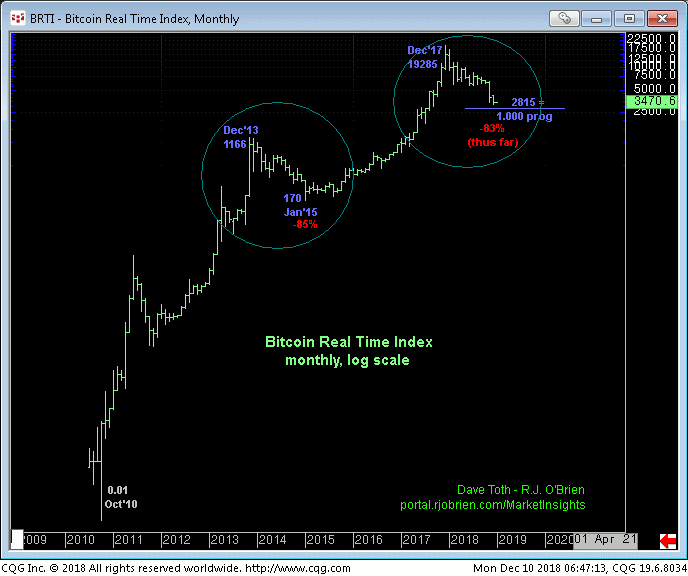
Given 2016-17’s stratospheric rise, we introduced the prospect of a larger-degree correction that could mimic Dec’13-to-Jan’15’s prior correction that lopped off a whopping 85% of the market’s value. 11-1/2-months later the daily log scale chart of the underlying index below shows the correction/reversal just 2% away from equaling (i.e. 1.000 Fibonacci progression) the 2013-2015 decline.
Importantly and similarly, but inverted, to the manner in which the market peaked out 12 months ago, the daily log chart below shows the developing POTENTIAL for a bullish divergence in momentum following today’s break to yet another new low. This resumed weakness leaves 29-Nov’s 4405 high in its wake as the latest smaller-degree corrective high the market is now minimally required to recoup to even defer, let alone threaten the bear and CONFIRM the the divergence to the point of non-bearish action like short-covers and cautious bullish punts. Until and unless such 4405+ strength is shown, the trend remains down on all scales and should not surprise by its continuance or acceleration. In this regard this 4405 level serves as our new short-term but important risk parameter from which a still-advised bearish policy and exposure can be objectively rebased and managed.
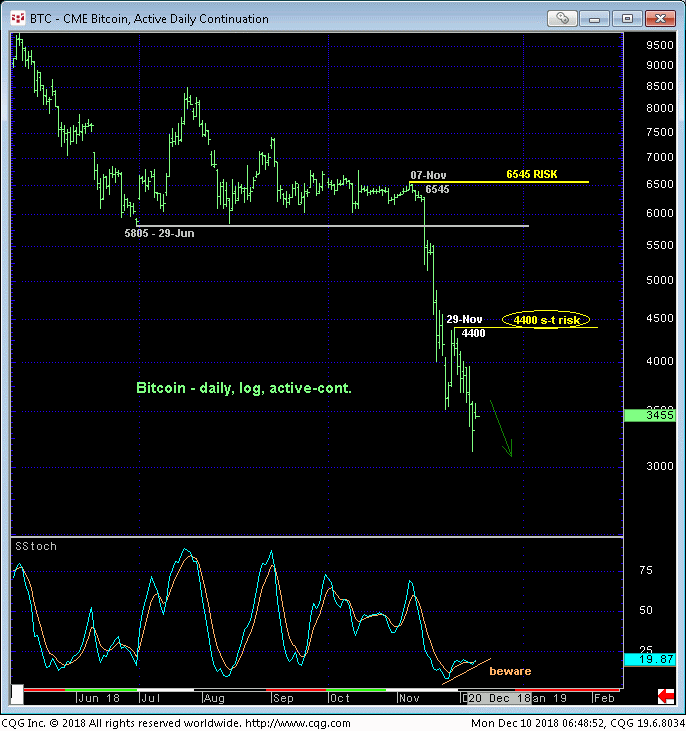
Basis the most-active futures contract (Dec currently), this tight but important bear risk parameter is defined by 29-Nov’s 4400 corrective high shown in the daily log active-continuation chart below.
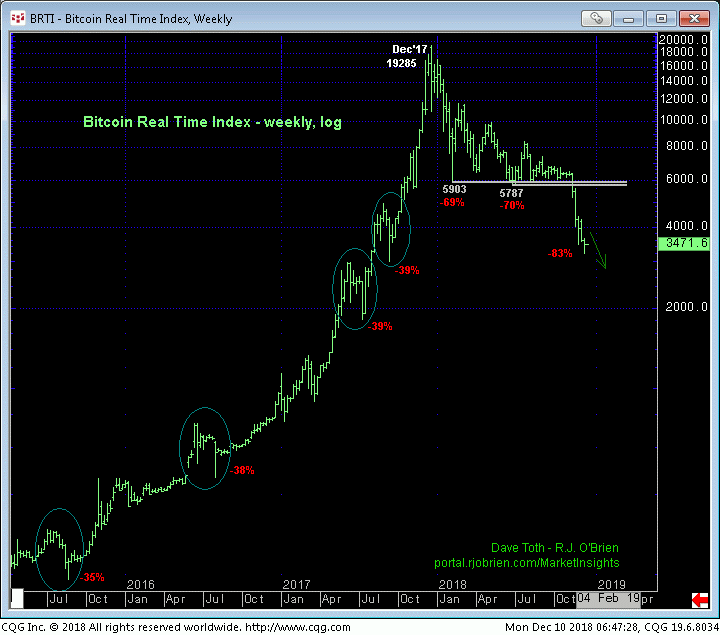
The weekly log chart of the index above shows how quickly between the first week of Jan 2018 and the first week of Feb the correction exceeded the pattern of all previous 2016 and 2017 corrections that ranged from 35% to 39%, reinforcing a count calling for a more protracted correction or reversal lower. And while there’s no contrary opinion/sentiment data for this market. NO ONE was immune in 2017 from the proverbial cab driver or barkeep’s chatter about their and their cousin’s involvement in Bitcoin. The combination of 20Dec17’s easily recognizable bearish divergence in momentum and tulip bulb society-like froth was a very powerful one that is still wreaking havoc with Bitcoin bulls today.
But there’s hope, however (although “hope” is not an investment strategy).
The monthly log scale char of the index below shows the market closing in on the 2815-area that would render the current bear trend the same length (i.e. 1.000 progression) as the last major correction from Dec’13 to Jan’15 that saw the market lose 85%. This Fibonacci relationship is a “derived” one however that- like ALL technically derived indicators like Bollinger Bands, imokus, trend lines and the ever-useless moving averages- have NEVER proven to be reliable reasons to identify support or the end of a falling-knife trend without an accompanying bullish divergence in momentum needed to, in fact, stem the clear and present downtrend.
Herein lies the importance of 29-Nov’s 4400 corrective high in the contract, the recovery above which would CONFIRM a bullish divergence in momentum and reject/define a more reliable and specific low from which any non-bearish decisions like short-covers or even cautious bullish punts could only then be objectively based and managed. In lieu of such 4400+ strength is proven, the trend remains down and should not surprise by its continuance or acceleration with remaining downside potential as indeterminable now as it was a week or month or year ago.
In sum, a bearish policy remains advised with a recovery above 4400 required to threaten this cal enough to warrant its cover. But even such proof of strength would only satisfy the first of our three reversal requirements. Proof of trendy, impulsive behavior on such a rebound would satisfy the second requirement, but the third requirement of proof of labored, corrective, 3-wave behavior on a subsequent relapse/retest of the lower would then have to be satisfied before one could/should objectively move back to a bullish view of bitcoin.
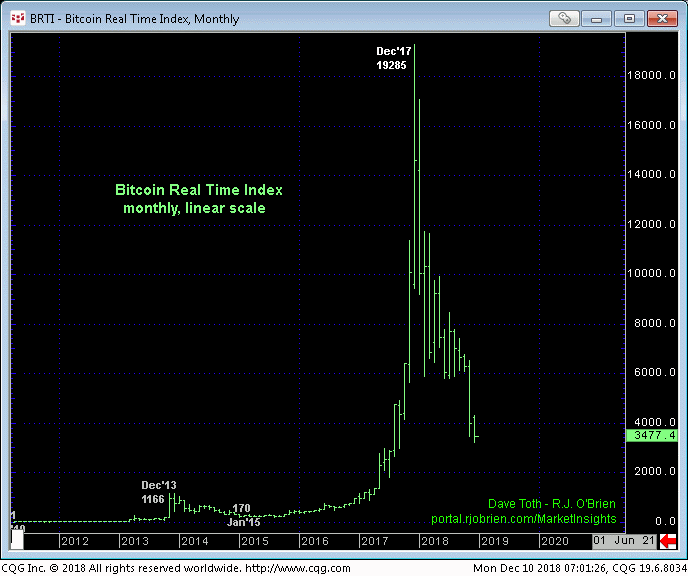
While we always resort to logarithmic charts when analyzing major vertical and/or very long-term moves, the monthly linear chart below better shows the stratospheric manner in which bitcoin exploded in 2016-17 and the tulip bulb-like craze that it incited. Such rare, crazed moves rarely end in any other way than the way this one ended in 2018. But perhaps now that all of the craze aspects have been eliminated and if/when the market stems the clear and present downtrend with a recovery above a corrective high like 4400, this bitcoin market will evolve from a phenomenon to a more legitimate market with more worldwide participation that may sharply reduce its insane historical volatility of the past three years.
