For corn traders wondering when this market’s secular bull market will end and for S&P traders wondering if the past couple days’ spasm is the start of a major reversal, we’ve recently and often been discussing our three reversal requirements that are typical of virtually all major reversals (in these cases, a top):
- a confirmed bearish divergence in momentum of a scale sufficient to even threaten, let alone break the major trend
- proof of trendy, impulsive behavior in the suspected direction of the new trend (down), and, most importantly,
- proof of labored, 3-wave corrective behavior on a subsequent rebuttal to the initial counter-trend decline.
Technical and trading SCALE is also of paramount importance as major peak/reversal threats simply cannot be concluded by proof of just smaller-degree weakness. While the past couple days’ decline in the S&P has garnered a lot of attention, this setback is thus far of a grossly insufficient SCALE to be considered anything more than another corrective hiccup and buying opportunity by longer-term players. If you’re a shorter-term trader, Tue’s short-term failure below 4110 was sufficient to get you out.
Similarly and relative to the mammoth rally in corn, the past few days’ slip is thus far pertinent to only short-term traders and far from the requisite behavior required to suggest the secular bull is over. To get a bird’s eye view of our three reversal requirements, today’s break below 27-Apr’s 47690 initial counter-trend low in the May bitcoin contract provides an excellent example. When the corn and S&P market’s provide the type of price action that the bitcoin market has provided over the past FOUR WEEKS, more legitimate and objective discussions about major peak/correction/reversal threats can be had.
In 23-Apr’s Technical Blog, we introduced a major peak/correction/reversal threat following that day’s confirmed bearish divergence in daily momentum below 25-Mar’s 50360 corrective low. This failure broke at least the uptrend from 27-Jan’s 29340 low, defined 14-Apr’s 65520 high as one of developing importance and satisfied the first of our three reversal requirements. The prospect (at that time) that mid-to-late-Apr’s sell-off attempt was a trendy, impulsive 5-wave structure arguably satisfied the second of our three reversal requirements.
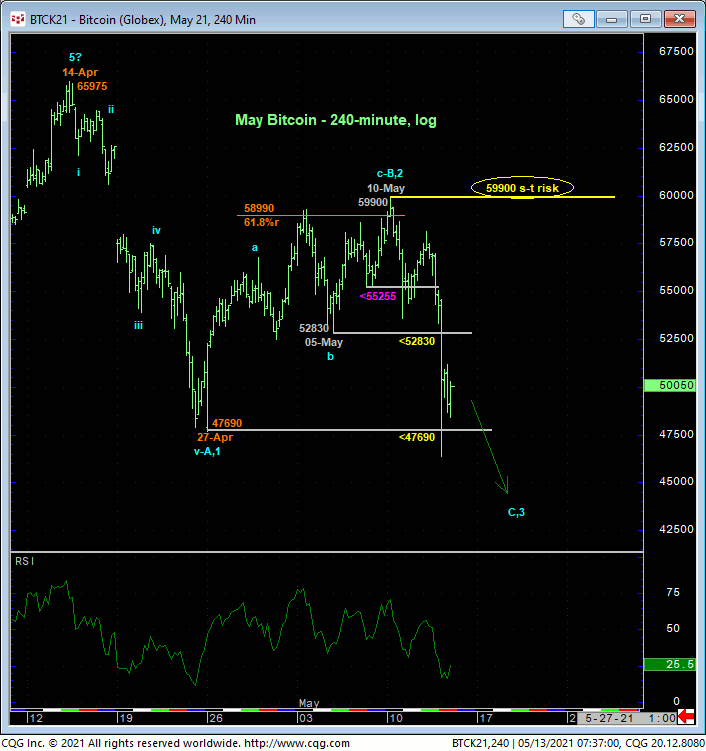
In Mon’s Technical Blog and as a result of the prior couple weeks’ recovery attempt, we identified smaller-degree corrective lows at 55255 and 52830 the market needed to sustain gains above to maintain a more immediate bullish count. Its failure to do so later in the day Mon and certainly today not only breaks the recovering uptrend from 27-Apr’s 47690 low, but also renders it a 3-wave and thus corrective affair that satisfies our third key reversal requirement. At this point and as a direct result of today’s break below 23-Apr’s 47395 initial count-trend low in the then-prompt Apr contract, we can factually state that the broader trend is now down. And most important to this call is the market’s precise definition of 10-May’s 59900 high and obviously 14-Apr’s 65520 high as THE levels this market is now required to recoup to negate this bearish call, render the sell-off from Apr’s high a 3-wave and thus (broader) correction and reinstate the secular bull trend. This specific identification of risk is critical to every market bet and arguably the key tenet of technical discipline. Until and unless this market recoups these levels, its downside potential is indeterminable and potentially extreme.
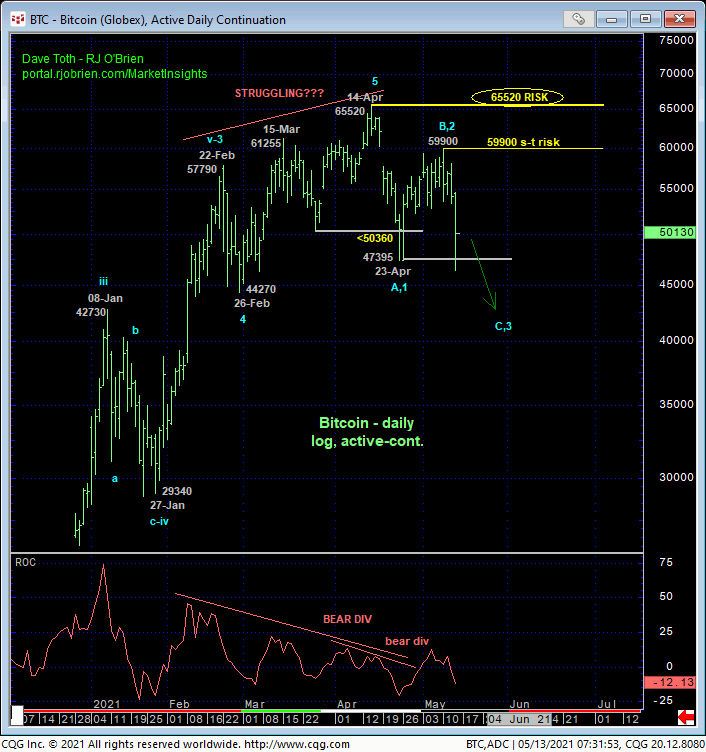
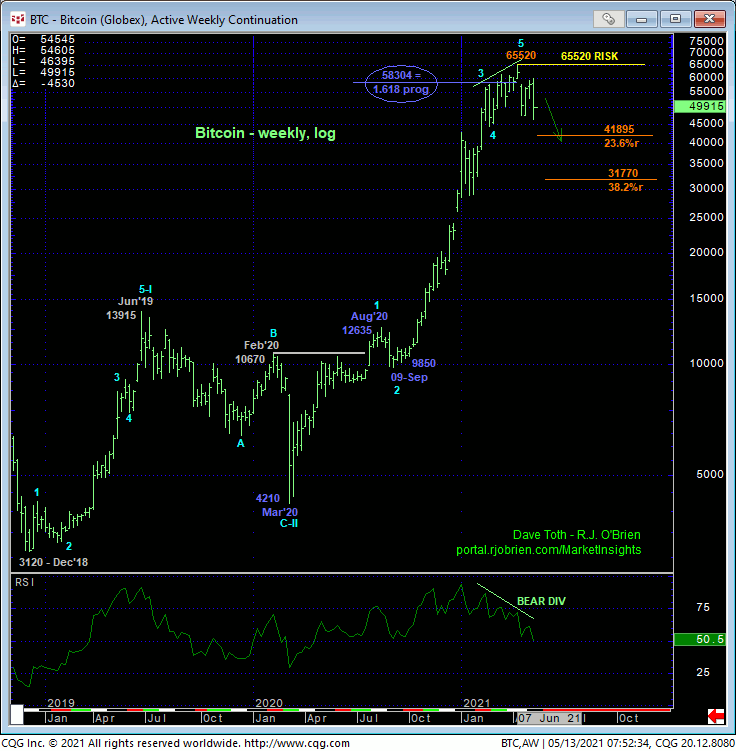
The weekly log chart below shows the magnitude of the secular bull trend, where even a relative minor correction could mean steep nominal losses. This market has, in fact, confirmed a bearish divergence in momentum that breaks the uptrend from at least 09Sep20’s 9850 low where even Fibonacci minimum 23.6% and 38.2% retraces don’t cut across until 41895 and 31770. And if 14-Apr’s 65520 high completed a major 5-wave Elliott sequence from Mar’20’s 4210 low, the correction or reversal lower would be only that much greater. And again, if this bearish count is wrong, all the bull’s gotta do is recover above at least 59900. Until and unless such 59900+ strength is shown, further and possibly protracted losses straight away should not surprise.
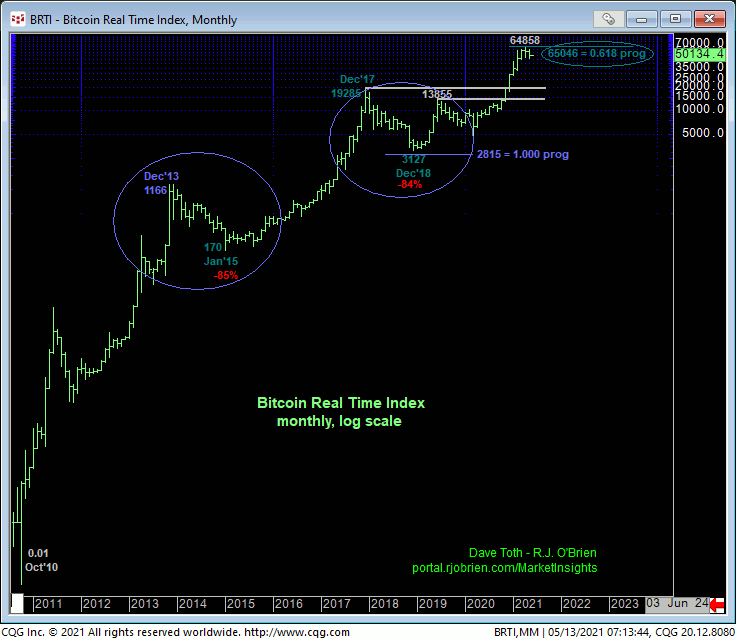
Finally and now that the market has confirmed a bearish divergence in momentum that breaks the major uptrend and identifies specific and objective highs, resistance and bear risk parameters, we’d like to remind long-term players of an interesting and now applicable Fibonacci progression relationship. On a monthly log scale basis of then underlying Bitcoin Real Time Index below, it’s fascinating that the resumed secular bull trend from Dec’18’s 3127 low came within a couple hundred points of its (65046) 0.618 progression of Jan’15 – Dec’17’s preceding portion of the major bull from 170 to 19285. As always, all such merely “derived” and so-called “technical levels” like Bollinger Bands, imokus, trend lines, the ever-useless moving averages and even the vaunted Fib levels are useless in the absence of an accompanying confirmed bearish (in this case) divergence in momentum. Such an accompanying mo failure is critical to navigating a trend change because it allows us to identify specific risk parameters from which directional exposure can only then be objectively based and managed. And the past few weeks’ momentum failure in this market has identified precisely such levels.
These issues considered, all previous bullish exposure and policy has now been nullified ahead of a peak/correction/reversal threat that could be major in scope. Further and possibly long-term losses straight away should not surprise until and unless negated by a recovery above at least 59900. As for corn and S&P traders, we recommend referring to the daily chart of bitcoin above as a sort of template from which to base the inevitable peak/reversal threats in these markets. The forces behind these massive bull trends will not evaporate overnight, but rather will likely take weeks or even months of peak/reversal-threat behavior that typically includes a slowed rate of ascent ahead of proven weakness below larger-degree corrective lows required to satisfy even the first of our three reversal requirements. Until this requirement is satisfied, setback attempts like this week’s are advised to first be approached as corrective buying opportunities.