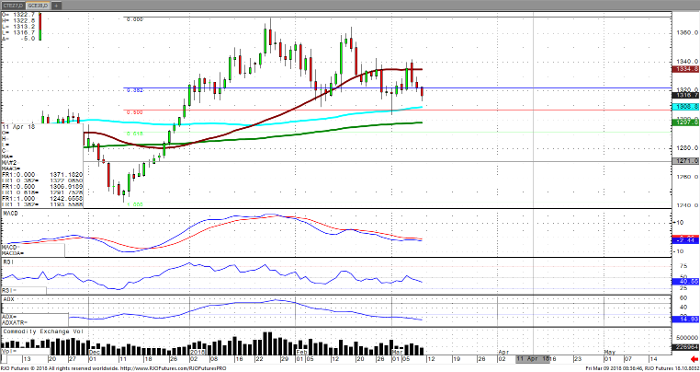
April gold has seen range bound trade for months now and has very clear areas of support and resistance. Right now, April gold is trading around 1317, down 5 on the day. Looking at where gold is likely to find support is around the very psychologically and technically important level of 1300. This also marks the 200-day moving average. A drop to around 1292 also marks an important level where a 62% retracement level drawn from the December 12 low to the January 25 high would come into play.
If you look at where gold could go from here, bearish factors would include a lack of volatility continuing minus the February selloff and a lack of any war rhetoric from North Korea after Trump has agreed to sit down with the leader. Inflation is expected to be a very real issue this year, and if the Fed steps up to increase interest rates higher than three times we could see gold come under very real pressure. On the contrary, we could see the opposite if interest rates are being raised at that rate it could indicate a very toppy stock market and a flight to safe haven assets such as gold could result. Another bearish factor we must consider here is with Trump imposing strong tariffs on steel and aluminum from countries around the world we could see a slowdown in global growth based on a trade war. China is sure to be the top target on the list with the highest US trade deficit, and their retaliation could be quite burdensome for the US economy.
Gold Apr ’18 Daily Chart


